


In many ways, identifying the problem is harder than solving it. At least in IT.
In order to better understand the performance of Nodes in a cluster and User VMs, ESXTOP for ESXi hypervisors and TOP for Linux OS based machines provide us an immediate birds eye view of the performance of the host.
It is important to understand the output as a tool towards problem-solving. Here I aim to discuss scenarios you might need to isolate and troubleshoot High CPU observed at the Hypervisor or User VMs.
ESXTOP :
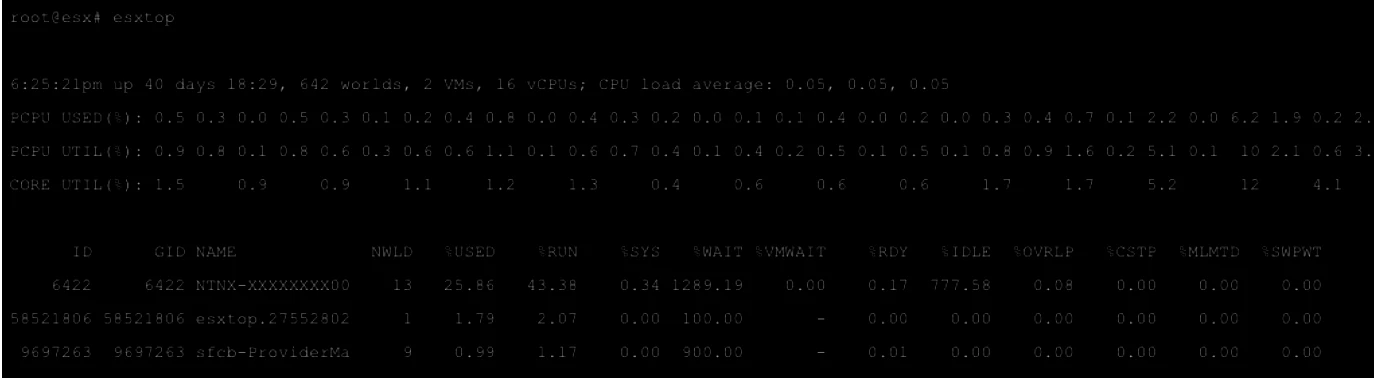
This command when run lists live CPU statistics specific to the Node the command is run on.
If you press “M” it shows you memory metric and “N” for network etc. As Always ‘H’ is for help.
We will focus on a few CPU statistics:
The output will show you all the VMs and the following metrics corresponding to them.
Some Important ones discussed below:
%USED, %RDY, %CSTP , %MLMTD and %SWPWT
Note:
To convert CPU ready % value to ms(milliseconds)
CPU ready % = ((CPU summation ready value in ms / number of vCPUs) / (<chart update interval in seconds> * 1000)) * 100
%USED - Tells you much time the VM spent executing CPU cycles on the host physical CPU.
%RDY - Tells you how much time the VM wanted to execute CPU cycles on the host physical CPU but did not get access.
This either tells you that the physical CPU is busy/over-committed or the some VM CPU is too big to allow enough CPU threads for other VMs to execute on.
%CSTP - Combined with the information from %RDY, %CSTP tells you how much time a virtual machine is waiting for a virtual machine with multiple vCPU to catch up. In this case, we should lower the no of vCPU on the VM.
%MLMTD - tell you how much time the vCPU was ready but was deliberately wasn’t scheduled CPU cycles due to violation of CPU limit set in vSphere. Should not be more than 0.
%SWPWT - If this value is larger than 5%, this tells you that the VM is waiting on swapped pages to be read from disk. This means the Physical memory over commitment and memory reclaim techniques are being employed.
ON AHV:
You can use top which is similar to esxtop.
Note:
Prism CPU statistics will show higher utilization than top because Prism accounts for hyperthreading improvements while top considers hyperthreaded core as a fully available core.
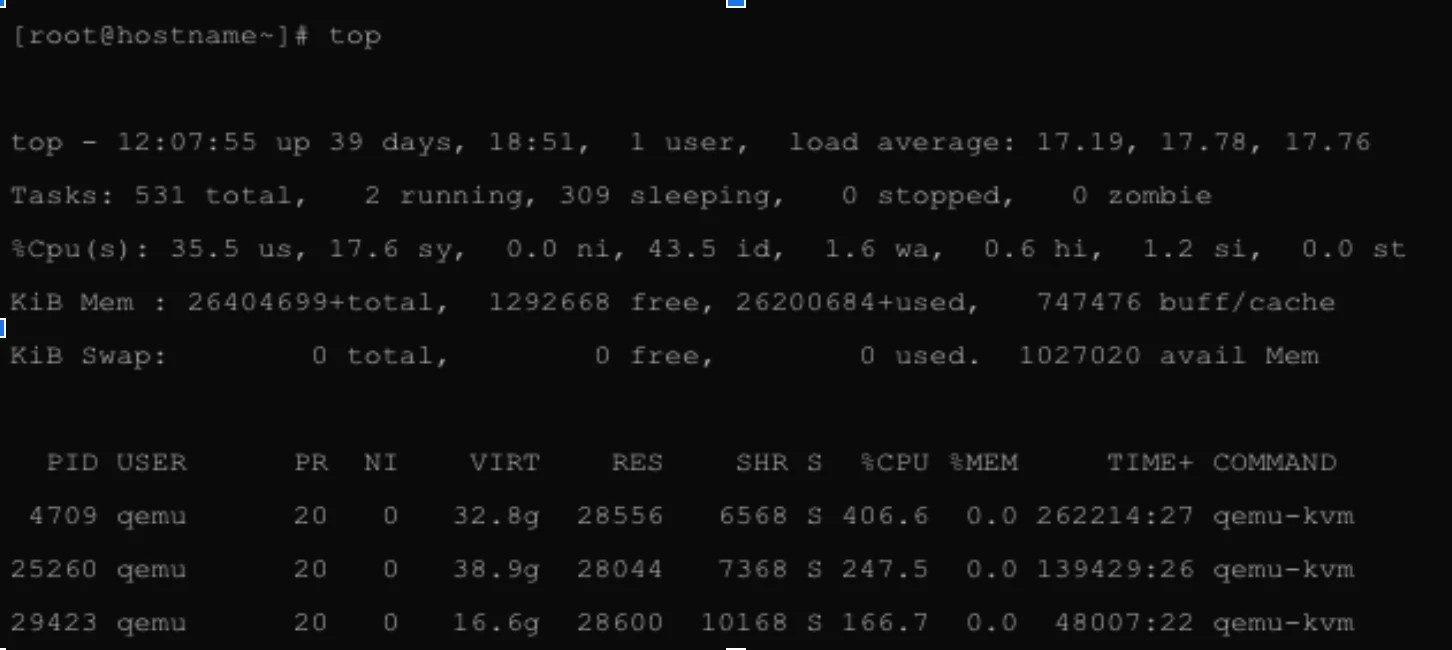
Following are the meanings of the %CPU statistic columns, from left to right:
us: user cpu time (or) % CPU time spent in user space.
sy: system cpu time (or) % CPU time spent in kernel space.
ni: user nice cpu time (or) % CPU time spent on low priority processes.
id: idle cpu time (or) % CPU time spent idle.
wa: io wait cpu time (or) % CPU time spent in wait (on disk).
hi: hardware irq (or) % CPU time spent servicing/handling hardware interrupts.
si: software irq (or) % CPU time spent servicing/handling software interrupts.
st: steal time - - % CPU time in involuntary wait by vCPU while hypervisor is servicing another processor (or) % CPU time stolen from a virtual machine.
There are 3 general states of CPU:
-
Idle - Which meant the CPU has nothing to do.
-
User space - like running a command shell or email or programs
-
Kernel space - servicing interrupts or managing resources.
Some useful top commands:
-
‘top’ to show the output and ‘q’ to quit
-
Shift+O - to sort the output by a particular letter.
-
‘d’ to change the refresh rate
-
Shift+P to sort processes as per CPU utilization
-
To save the current top as output
top -n 1 -b > top-output.txt
-
‘u’ to display specific user process
-
‘c’ to display the absolute path of the processes.
Must Reads:
-
This is ancient but it is the ESXTOP bible.
-
KB-7282 - How to collect esxtop data in batch mode and analyze it using Windows Performance Monitor
-
KB-2345 - [Performance] Troubleshooting high CPU in Nutanix environments