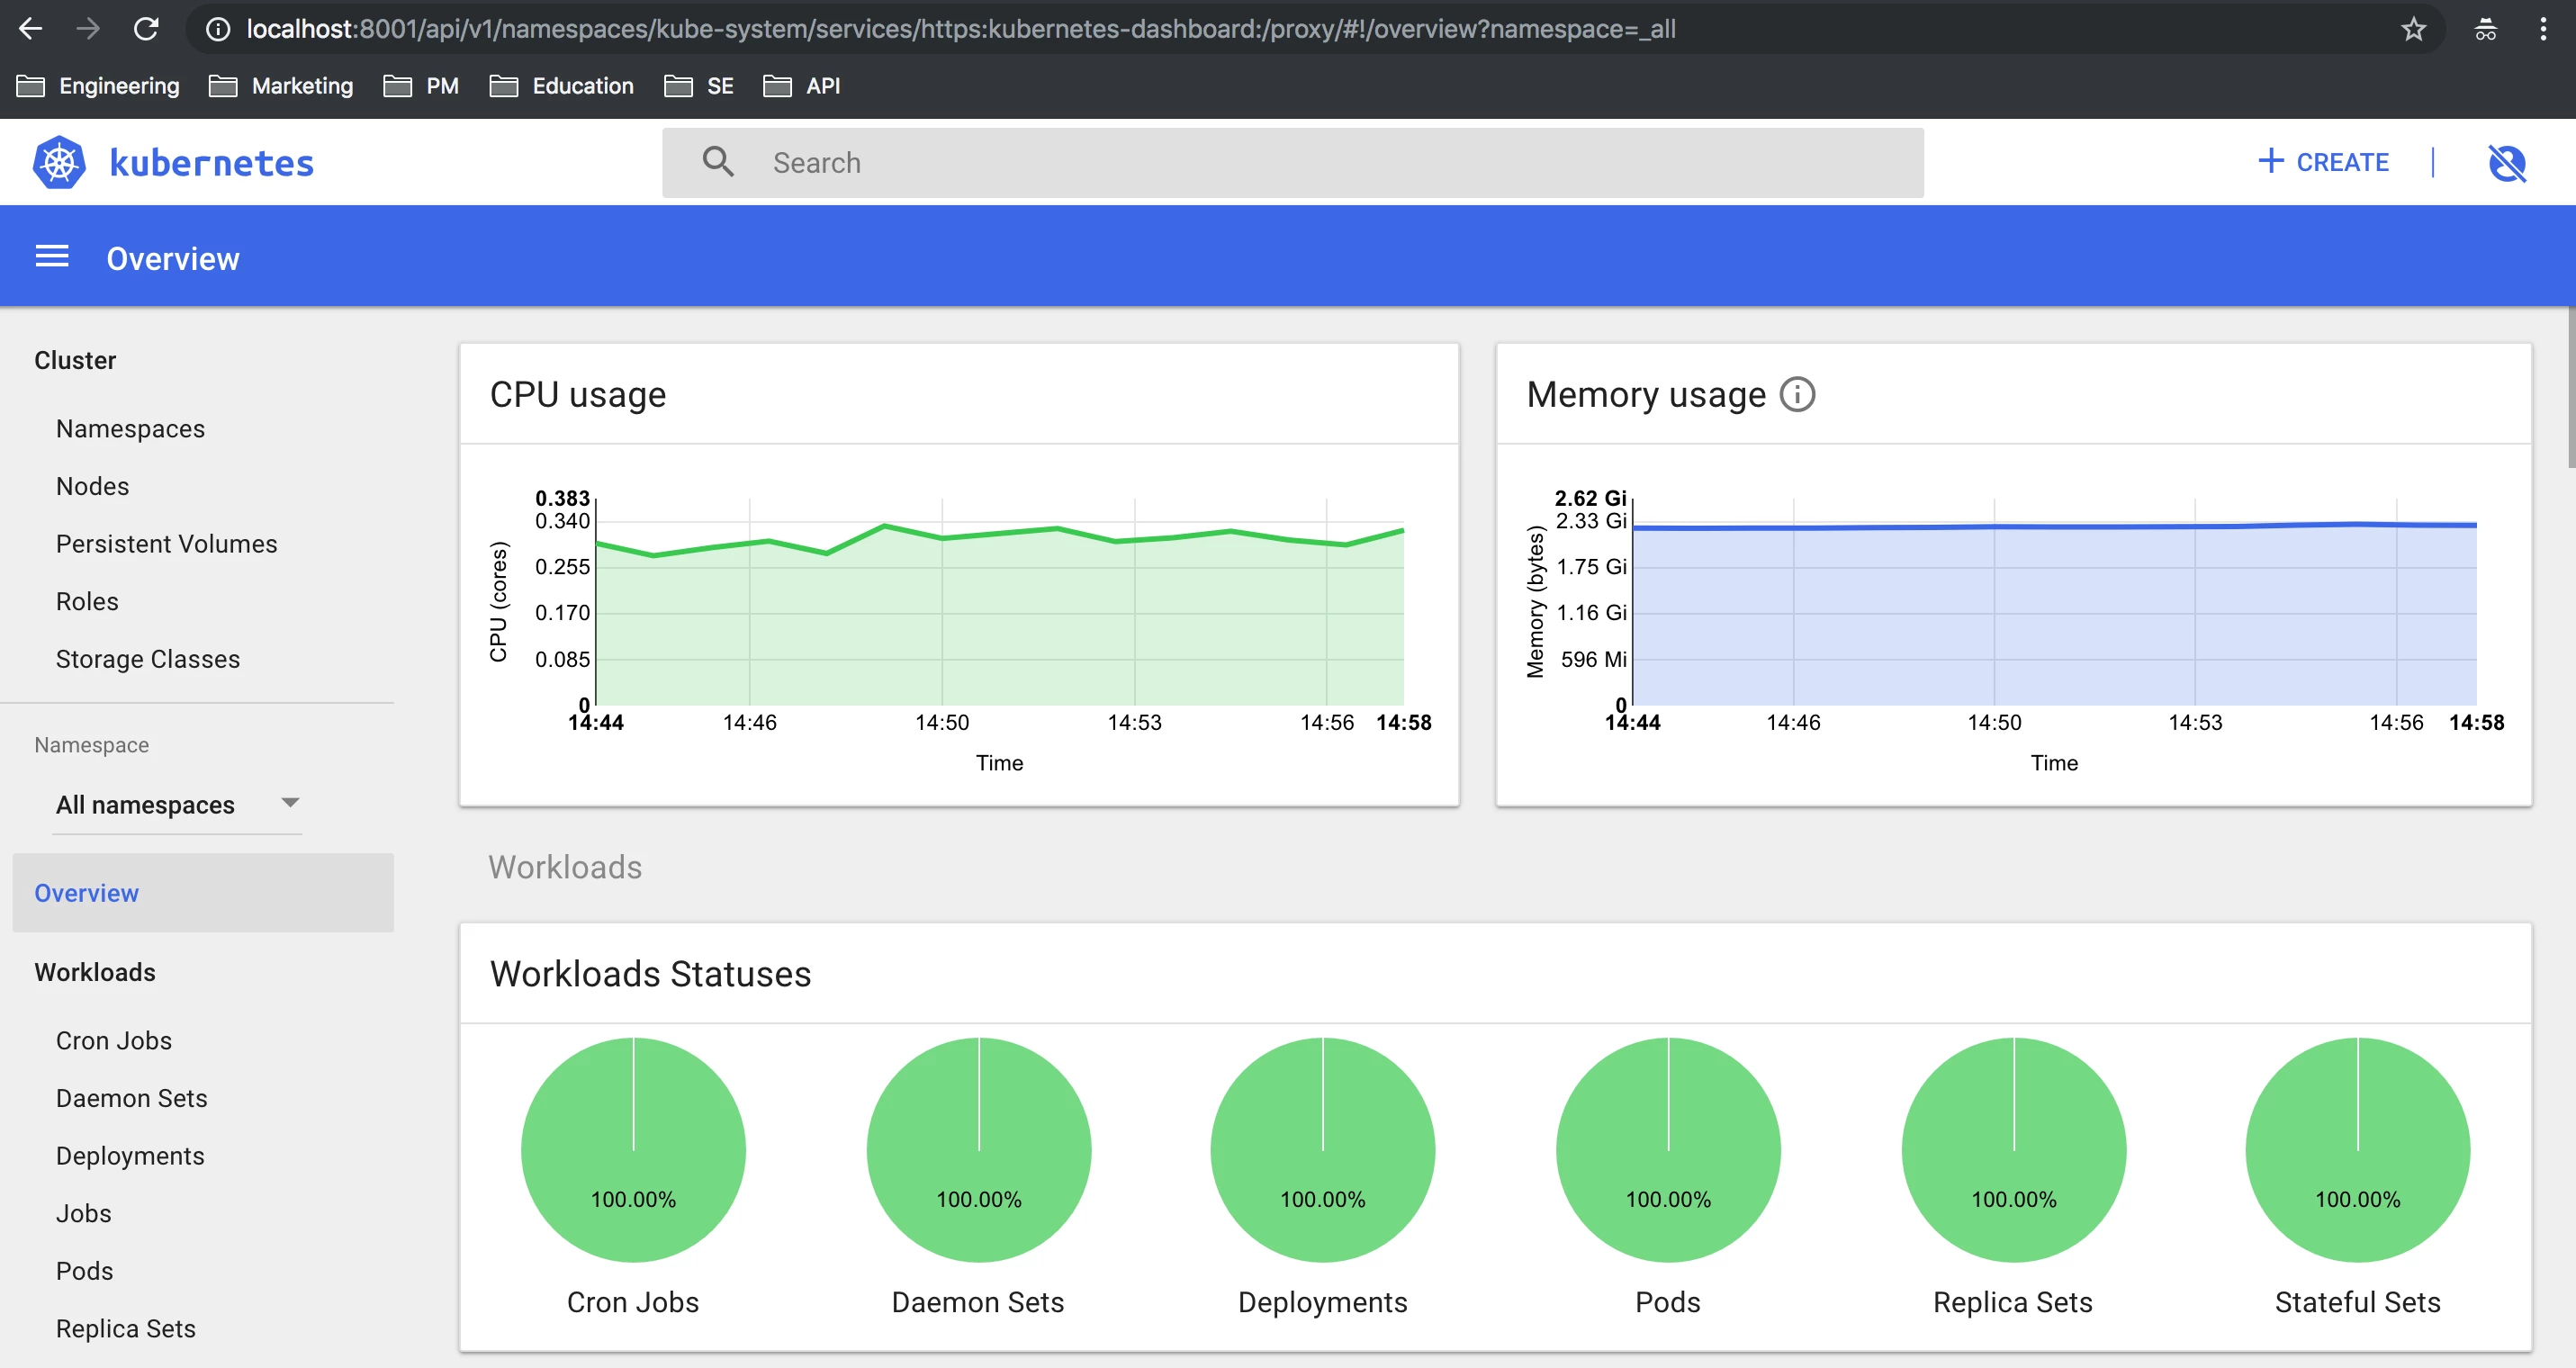
This post walks you through the process to successfully deploy the Kubernetes Dashboard addon.
Before you can start with the deployment of the addon you need a working Kubernetes cluster and the kubectl CLI-tool.
The steps to follow are:
- Deploy Heapster
- Deploy Kubernetes Dashboard
- Connect to Kubernetes Dashboard
Deploying Heapster
From Heapster website:Heapster enables Container Cluster Monitoring and Performance Analysis for Kubernetes (versions v1.0.6 and higher), and platforms which include it.
Heapster is deprecated. Consider using metrics-server and a third party metrics pipeline to gather Prometheus-format metrics instead. See the deprecation timeline for more information on support.
The reason of using Heapster is because:
Currently only Heapster integration is supported with Kubernetes Dashboard, however there are plans to introduce integration framework to Dashboard. It will allow to support and integrate more metric providers as well as additional applications such as Weave Scope or Grafana.
To deploy Heapster, execute following commands:
- Clone the Heapster GitHub repo
code:
git clone https://github.com/kubernetes/heapster.git
- Move to the InfluxDB directory
code:
cd heapster/deploy/kube-config/influxdb
- Deploy InfluxDB
code:
kubectl create -f influxdb.yaml
- Replace the source value for the heapster.yaml manifest file from --source=kubernetes:https://kubernetes.default with --source=kubernetes.summary_api:''
code:
          command:
          - /heapster
          - --source=kubernetes.summary_api:''
          - --sink=influxdb:http://monitoring-influxdb.kube-system.svc:8086
- Deploy Heapster
code:
kubectl create -f heapster.yaml
- Check Heapster is running
code:
          kubectl get -f heapster.yaml
          NAME           SECRETS  AGE
          serviceaccount/heapster  1     50m

          NAME               DESIRED  CURRENT  UP-TO-DATE  AVAILABLE  AGE
          deployment.extensions/heapster  1     1     1      1      50m

          NAME        TYPE    CLUSTER-IP    EXTERNAL-IP  PORT(S)  AGE
          service/heapster  ClusterIP  172.19.173.162      80/TCP  50m
Deploying Kubernetes Dashboard
From Kubernetes Dashboard website:Kubernetes Dashboard is a general purpose, web-based UI for Kubernetes clusters. It allows users to manage applications running in the cluster and troubleshoot them, as well as manage the cluster itself.
To deploy Dashboard, execute following command:
code:
kubectl apply -f https://raw.githubusercontent.com/kubernetes/dashboard/master/src/deploy/recommended/kubernetes-dashboard.yaml
Connecting to Kubernetes Dashboard
To access Dashboard from your local workstation you must create a secure channel to your Kubernetes cluster. Run the following command:code:
kubectl proxy
Now access Dashboard at:
code:
http://localhost:8001/api/v1/namespaces/kube-system/services/https:kubernetes-dashboard:/proxy/
If you would like to access the Dashboard without use the proxy, you can use the following URL. Make sure you don't use Chrome because you will get a certificate warning and the Dashboard won't work. I recommend for the Dashboard you use Firefox. Make sure you replace localhost with your Kubernetes Master address.
Now access Dashboard at (credentials: admin / nutanix/4u ):
code:
https:// < master_address > /api/v1/namespaces/kube-system/services/https:kubernetes-dashboard:/proxy/
Congratulations! now you have a Kubernetes Dashboard with Heapster up and running.

