
Nutanix Karbon is a curated turnkey offering that provides simplified provisioning and operations of Kubernetes clusters. Kubernetes is an open-source container orchestration system for deploying and managing container-based applications.
Karbon was released in Tech-Preview after the launch of AOS 5.9 and Prism Central 5.9 in October 2018.
We’ve received several queries from our customers, partners and peers alike who value the simplicity that we bring to the table for Kubernetes, but they find it hard to understand how the cluster is behaving and what is going on under the covers.
Enter Prometheus (also known as Prom or P8s).
Prometheus is an open-source monitoring tool that was built by a team at SoundCloud and it was inspired by Google’s Borgmon, it was designed from day one for the Kubernetes model of assigning and managing units of work. Prometheus has an expression browser for ad hoc visualization, However, Grafana is typically used as a visualization dashboard on top of Prometheus.
While keeping in mind that Prometheus and Grafana will be included as an add-on in the future (Post GA) when a Karbon Cluster gets deployed. In this post I will walk you through the steps required to deploy Prometheus + Grafana on Nutanix Karbon using Helm and the Prometheus Operator. These steps can also be used to deploy Prometheus on a Vanilla Kubernetes cluster as well. :)
Let’s start.
Pre-requisites:
- A working Karbon Cluster with an internet connection. I used Kubernetes 1.10.3.
- kubectl installed on your laptop with kubeconfig configured.
These will be the steps that we will be performing at a high level.
Install Helm
Create RBAC Cluster Role
Create Service Account
Configure Cluster Role bindings to Service Account
Download and Install Helm
Initialize Helm
Install Prometheus Operator using Helm
Add CoreOS Repo
Install Prometheus Operator
Install Prometheus manifests
Expose a NodePort to access Grafana.
Installing Helm
Helm is a Kubernetes Package Manager which uses Helm Charts to help you define, install and upgrade applications which were built for Kubernetes.
Lets go ahead and install Helm.
Let’s first create a RBAC Cluster Role.
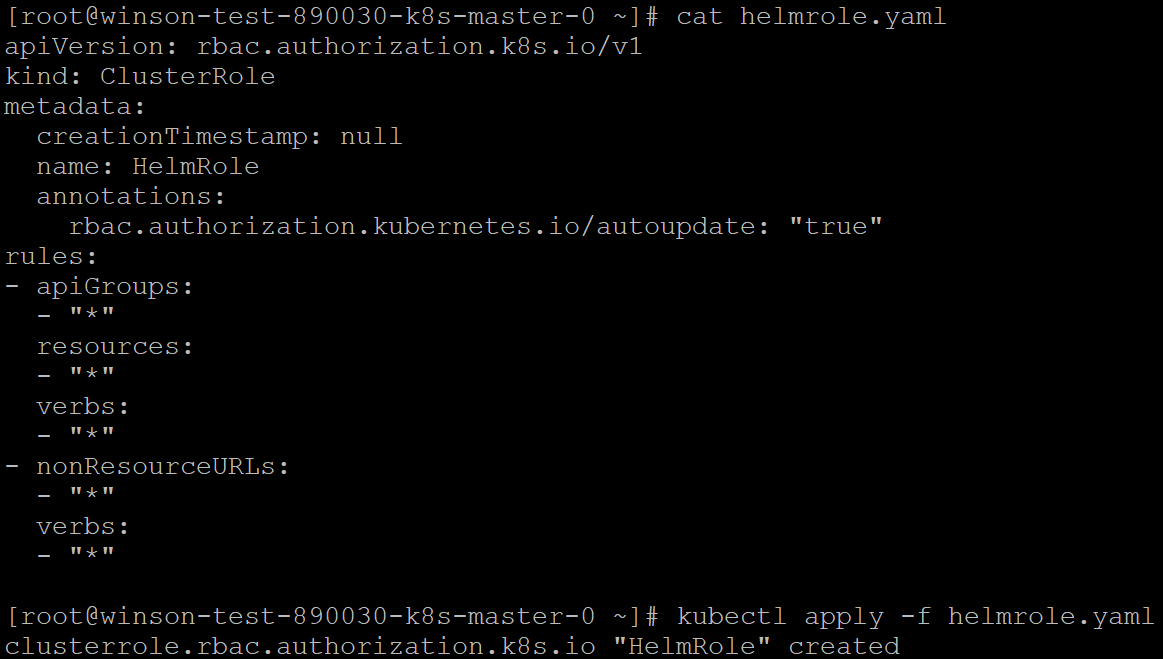
Use Kubectl to connect to your Karbon Cluster then apply the following Manifest. The following manifest creates a ClusterRole called “HelmRole” and assigns the role RBAC permissions. Note: These permissions essentially allow full access to the entire Karbon Kubernetes Cluster, hence use it with caution. Not recommended for production. For production use we recommend the RBAC rules be reviewed in a more stringent manner.
Using your favorite text editor, save the following manifest as helmrole.yaml
code:
apiVersion: rbac.authorization.k8s.io/v1
kind: ClusterRole
metadata:
  creationTimestamp: null
  name: HelmRole
  annotations:
    rbac.authorization.kubernetes.io/autoupdate: "true"
rules:
- apiGroups:
  - "*"
  resources:
  - "*"
  verbs:
  - "*"
- nonResourceURLs:
  - "*"
  verbs:
  - "*"
Once that’s done, use kubectl to apply the manifest to the Karbon Cluster.
Code:
code:
kubectl apply -f helmrole.yaml
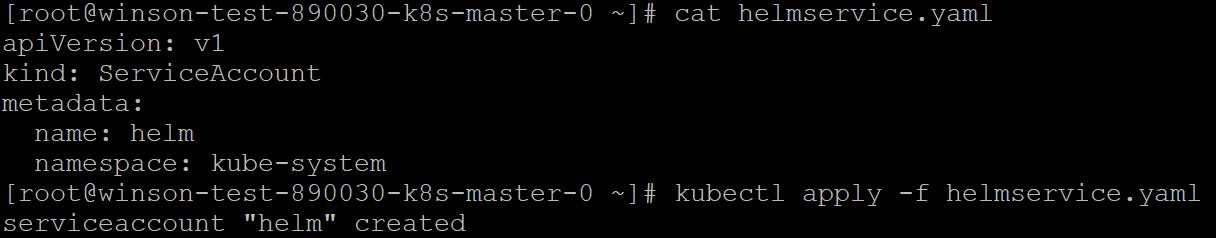
Once the ClusterRole has been created, our next step is to create a ServiceAccount for Helm to use. The following Manifest creates a ServiceAccount called “helm” in the kube-system namespace.
Using your favorite text editor, save the following manifest as helmservice.yaml
code:
apiVersion: v1
kind: ServiceAccount
metadata:
  name: helm
  namespace: kube-system
Once that’s done, use kubectl to apply the manifest to the Karbon Cluster.
Code:
code:
kubectl apply -f helmservice.yaml
Once the ServiceAccount has been created, our next step is to create a ClusterRoleBinding to bind the ClusterRole to the ServiceAccount. The following Manifest creates a binding of the “HelmRole” ClusterRole to the “helm” ServiceAccount.
Using your favourite text editor, save the following manifest as helmbinding.yaml
code:
apiVersion: rbac.authorization.k8s.io/v1beta1
kind: ClusterRoleBinding
metadata:
  name: helm
  namespace: kube-system
roleRef:
  apiGroup: rbac.authorization.k8s.io
  kind: ClusterRole
  name: HelmRole
subjects:
- kind: ServiceAccount
  name: helm
  namespace: kube-system
Once that’s done, use kubectl to apply the manifest to the Karbon Cluster.
Code:
code:
kubectl apply -f helmbinding.yaml

Now that we have created and configured the ClusterRole, ServiceAccount and ClusterRoleBinding, we can go ahead to download and install Helm.
Execute the following from your terminal. It will download the Helm Installer script.
Code:
code:
curl https://raw.githubusercontent.com/helm/helm/master/scripts/get > get_helm.sh

Next, Let change the permissions of the get_helm.sh file so that we will have permissions to execute it.
Execute the following from your terminal.
Code:
code:
chmod 700 get_helm.sh

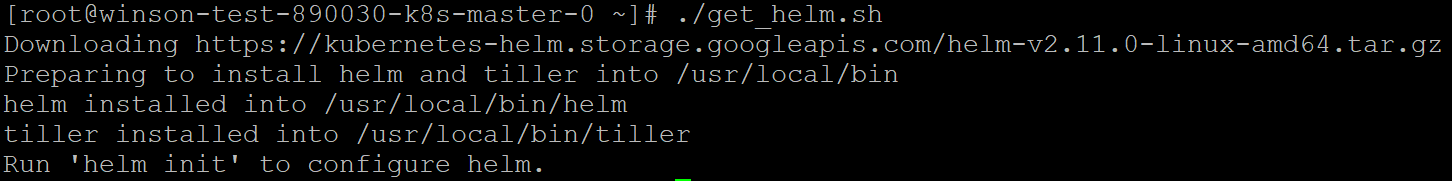
Now lets execute get_helm.sh to download and install Helm.
Execute the following from your terminal.
Code:
code:
./get_helm.sh
Once downloaded and installed, we now need to initialize Helm and to use the ServiceAccount we created earlier.
Execute the following from your terminal.
Code:
code:
helm init --service-account helm
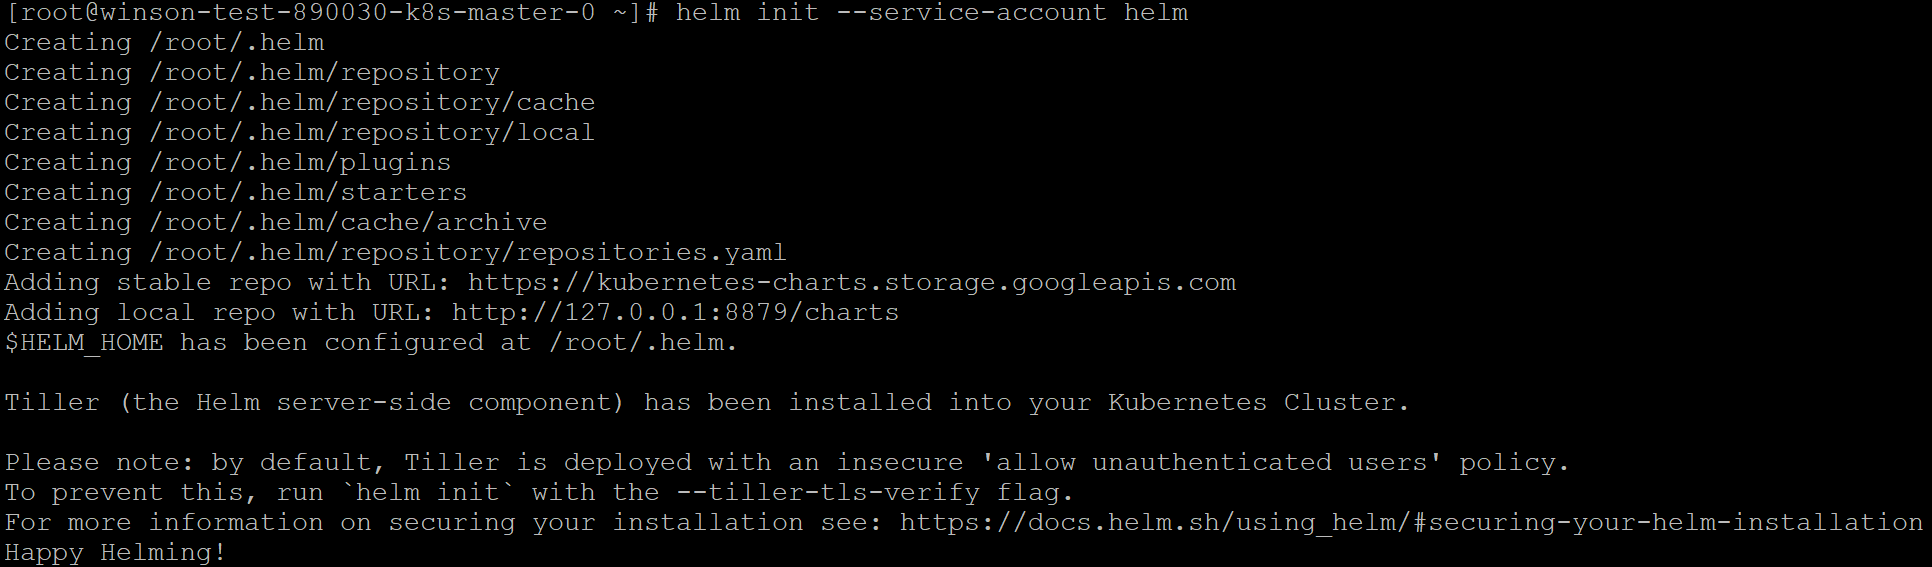
Congratulations! You now have Helm installed on your Karbon Cluster. Lets move on to the next step.
Deploying the Prometheus Operator
First, lets add the CoreOS Helm repository into Helm. Execute the following to add the repository.
Code:
code:
helm repo add coreos https://s3-eu-west-1.amazonaws.com/coreos-charts/stable/

Now that the repository has been added, we can go ahead and deploy the Prometheus Operator.
The following Helm command will deploy the Prometheus Operator on the Kubernetes Cluster in the namespace “monitoring”
Code:
code:
helm install coreos/prometheus-operator --name prometheus-operator --namespace monitoring
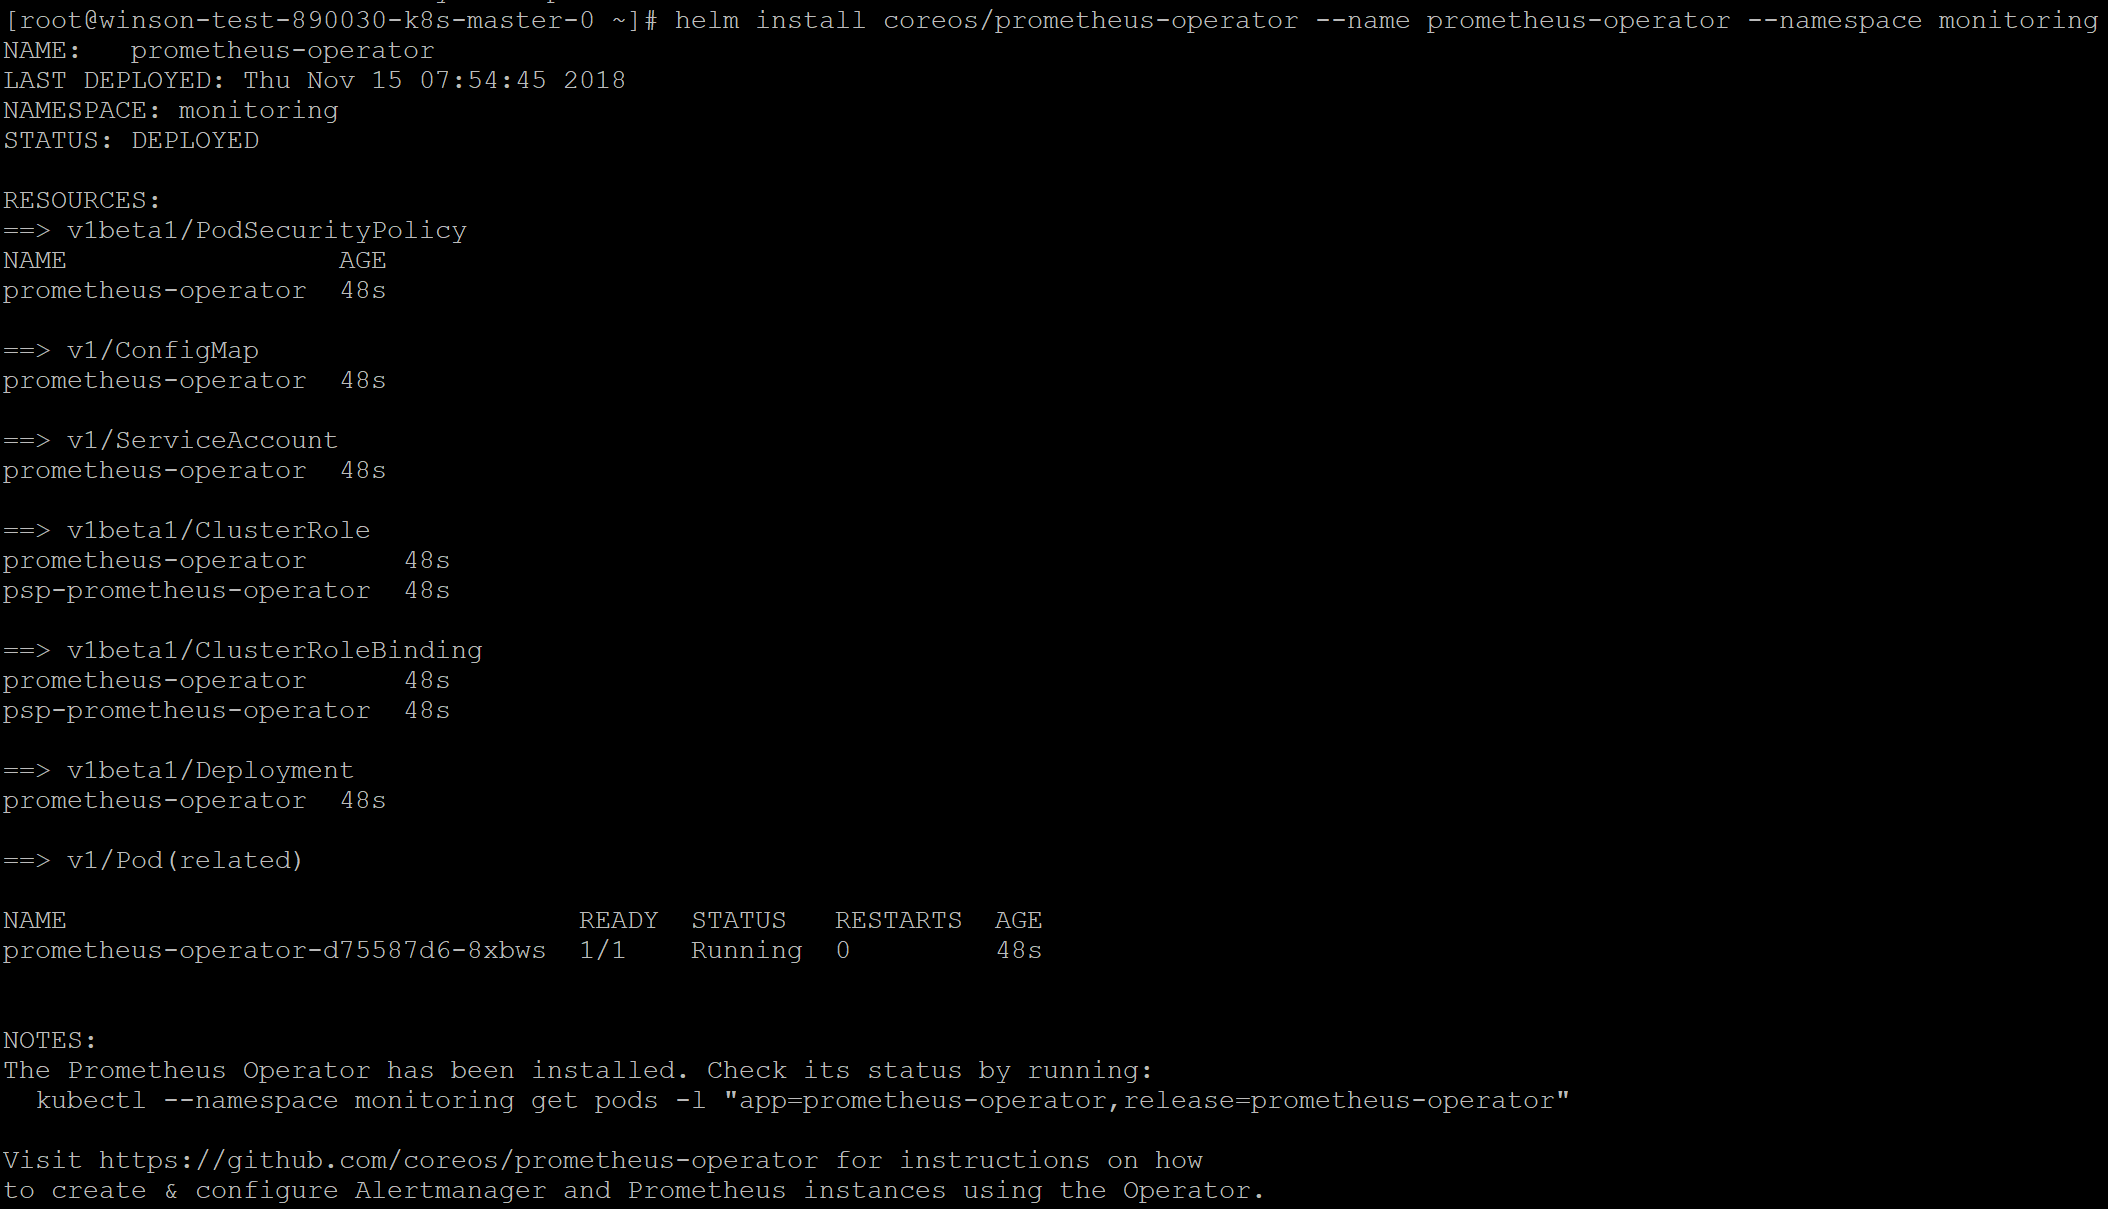
Done! Now have deployed Prometheus. Easy huh? 2 more steps are required before we can access the Dashboard.
First lets deploy the kube-prometheus Helm Chart to configure Prometheus and Grafana for us.
Execute the following Helm Command
Code:
code:
helm install coreos/kube-prometheus --name kube-prometheus --set global.rbacEnable=true --namespace monitoring
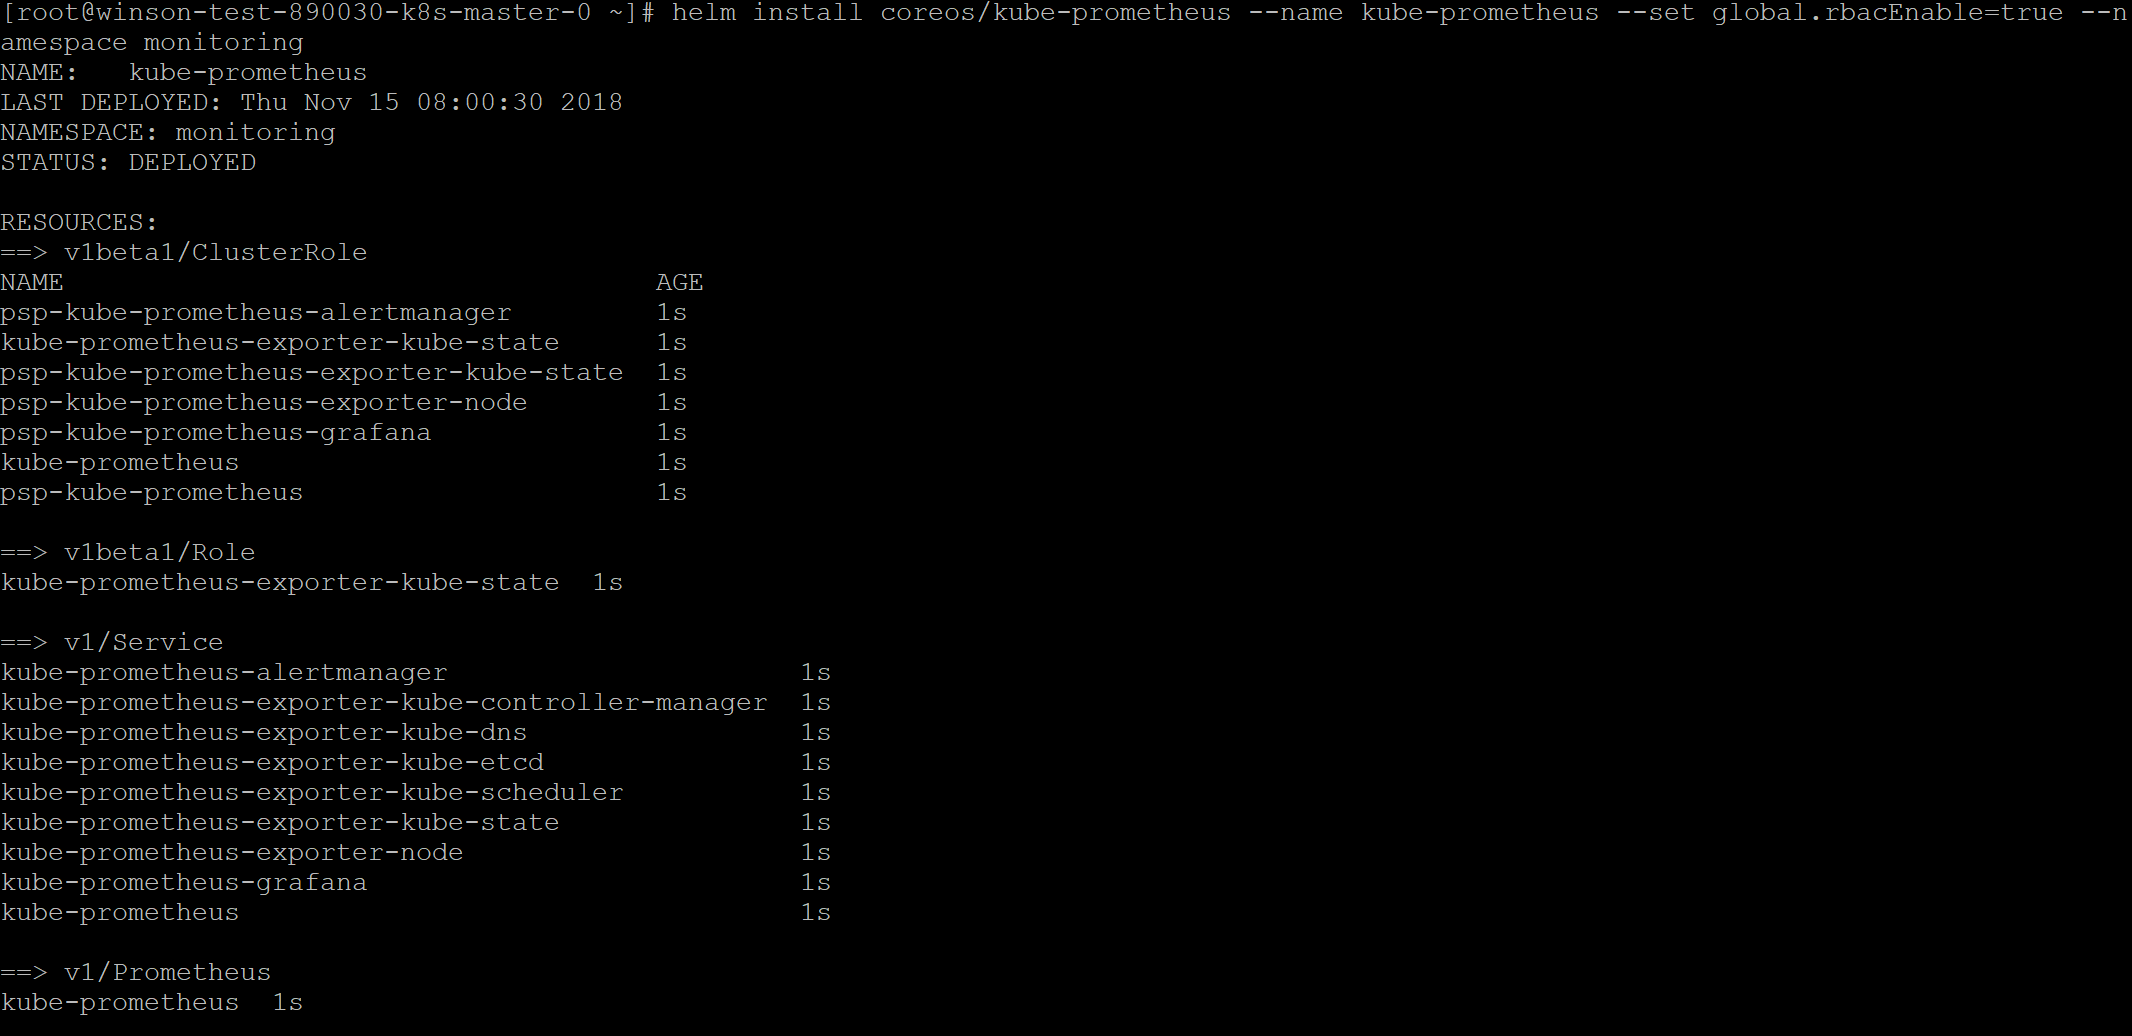
Now we have Prometheus and Grafana configured. Lets expose a NodePort for us to access Grafana.
The following Manifest will create a NodePort Service on Port 30900.
Using your favourite text editor, save the following manifest as grafanaservice.yaml
code:
apiVersion: v1
kind: Service
metadata:
  name: grafana-node-svc
  namespace: monitoring
spec:
  type: NodePort
  ports:
  - name: web
    nodePort: 30900
    port: 3000
    protocol: TCP
    targetPort: web
  selector:
    app: kube-prometheus-grafana
Once that’s done, use kubectl to apply the manifest to the Karbon Cluster.
Code:
code:
kubectl apply -f grafanaservice.yaml
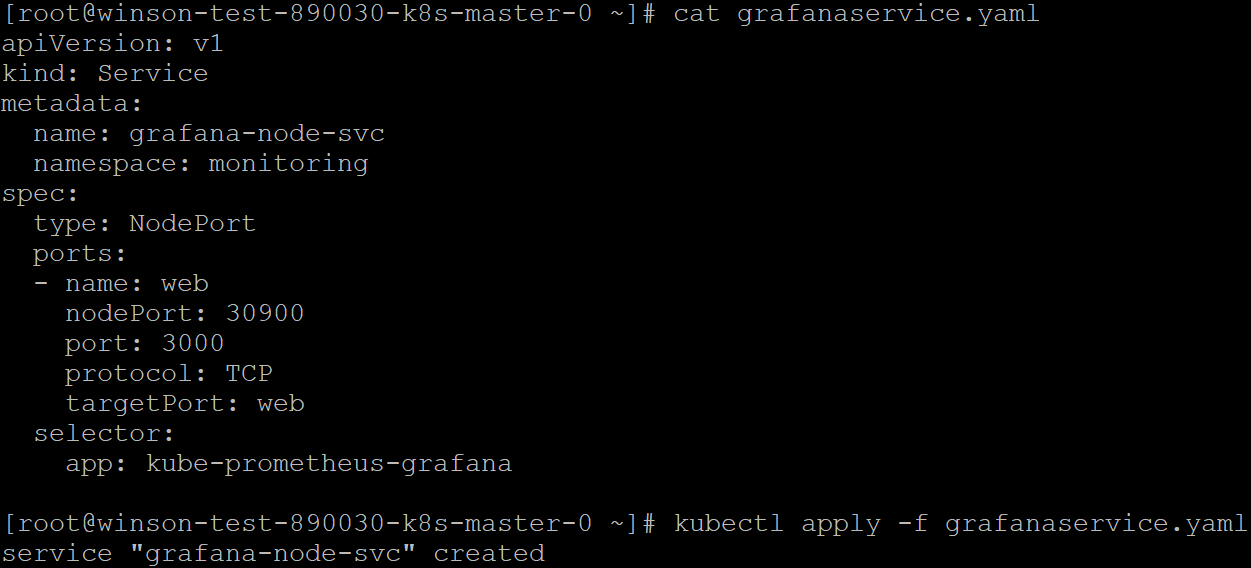
We now have Prometheus and Grafana deployed with a NodePort exposing 30900 to Grafana. Lets go ahead and access Grafana.
Accessing Grafana
You can access the Grafana Dashboards by navigating to https:// where NodeIP is the IP Address of any Karbon/Kubernetes Worker Node.
You can check for the IP Address using Prism or running the following kubectl command.
Code:
code:
kubectl get nodes -o jsonpath='{.items}'].status.addressess?(@.type=="InternalIP")].address}

We can now access the Grafana Dashboard by launching your favourite web browser and navigating to http://NodeIP:30900
In my case, my NodeIP is 10.139.76.251 so I’ll just navigate to http://10.139.76.251:30900
Here we see the homepage of the Grafana Dashboard
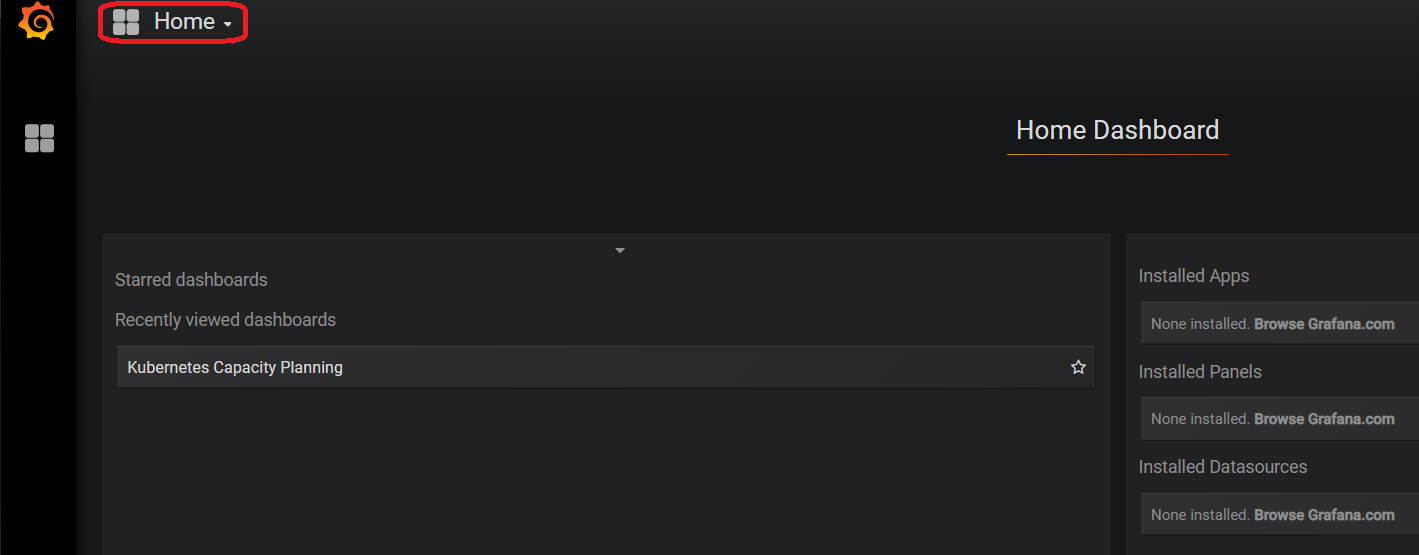
We can click on the Home Icon to get a list of pre-seeded dashboards that are available.
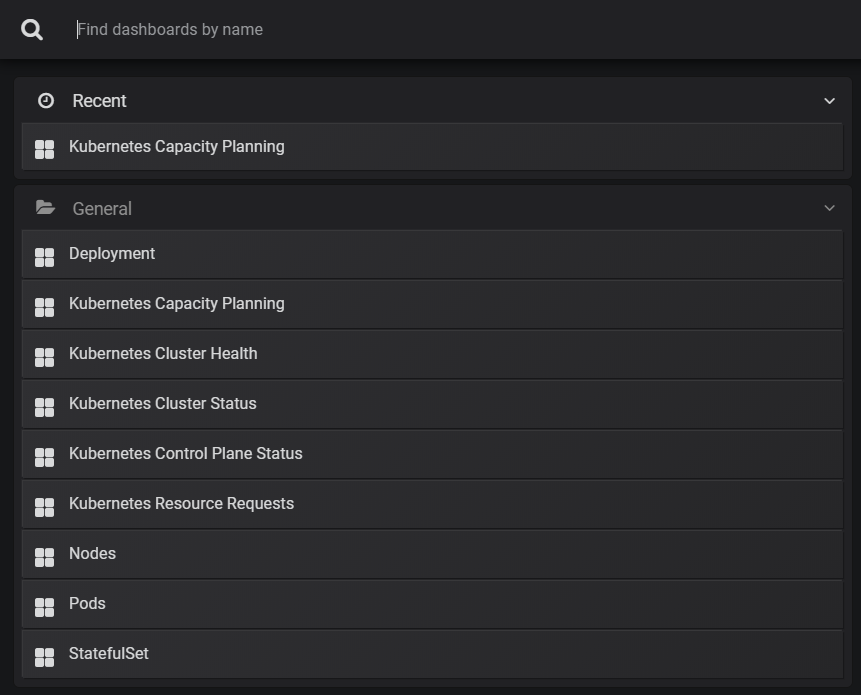
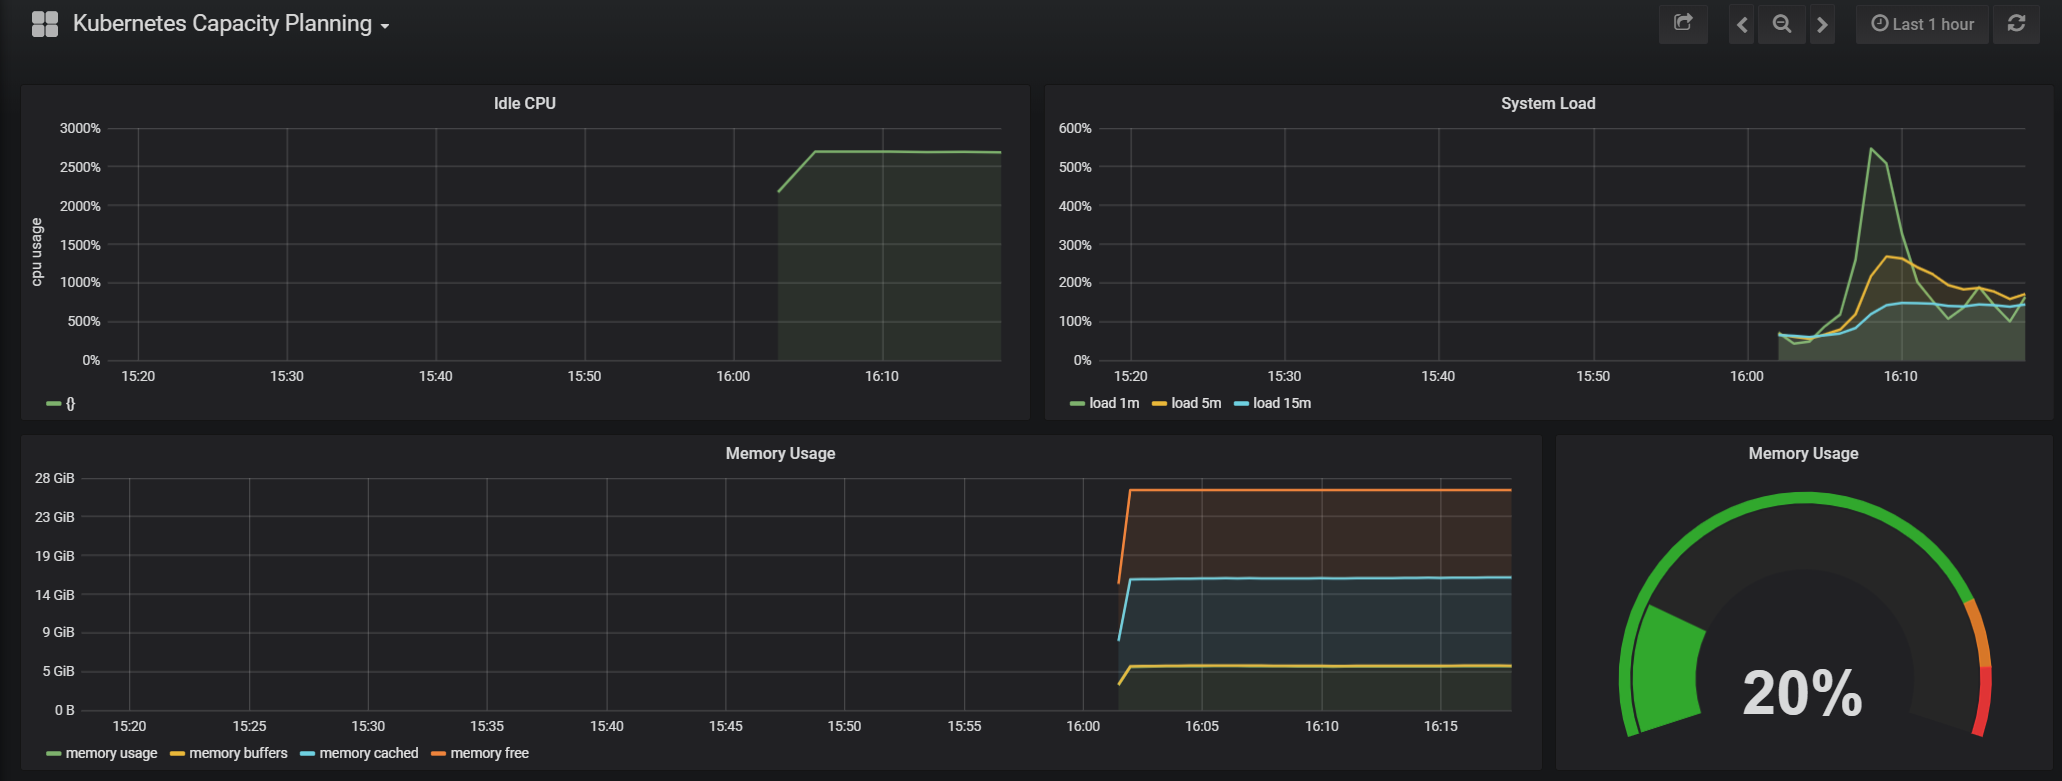
Here’s a Sample of the Kubernetes Capacity Planning Dashboard.
I hope this has been helpful. I'll be updating this post with the steps to use tillerless in the future.
In my next post, I’ll be sharing on how to deploy Nutanix Epoch on a Karbon Cluster.
Nutanix Epoch is an Application Tracing and Performance Monitoring Tool. It has the ability to perform tracing of applications running as Containers or Microservices. It works around the principals of the 4 golden signals by Google, namely Latency, Traffic, Errors and Saturation. Epoch can be deployed on Karbon or vanilla Kubernetes Cluster to monitor the health as well as map the dependencies of applications as well as the ability to give our customers insights when your services are starting to happens or if an application stops working.
Credits to: Denis Guyadeen, Jose Gomez for helping with this blog post.