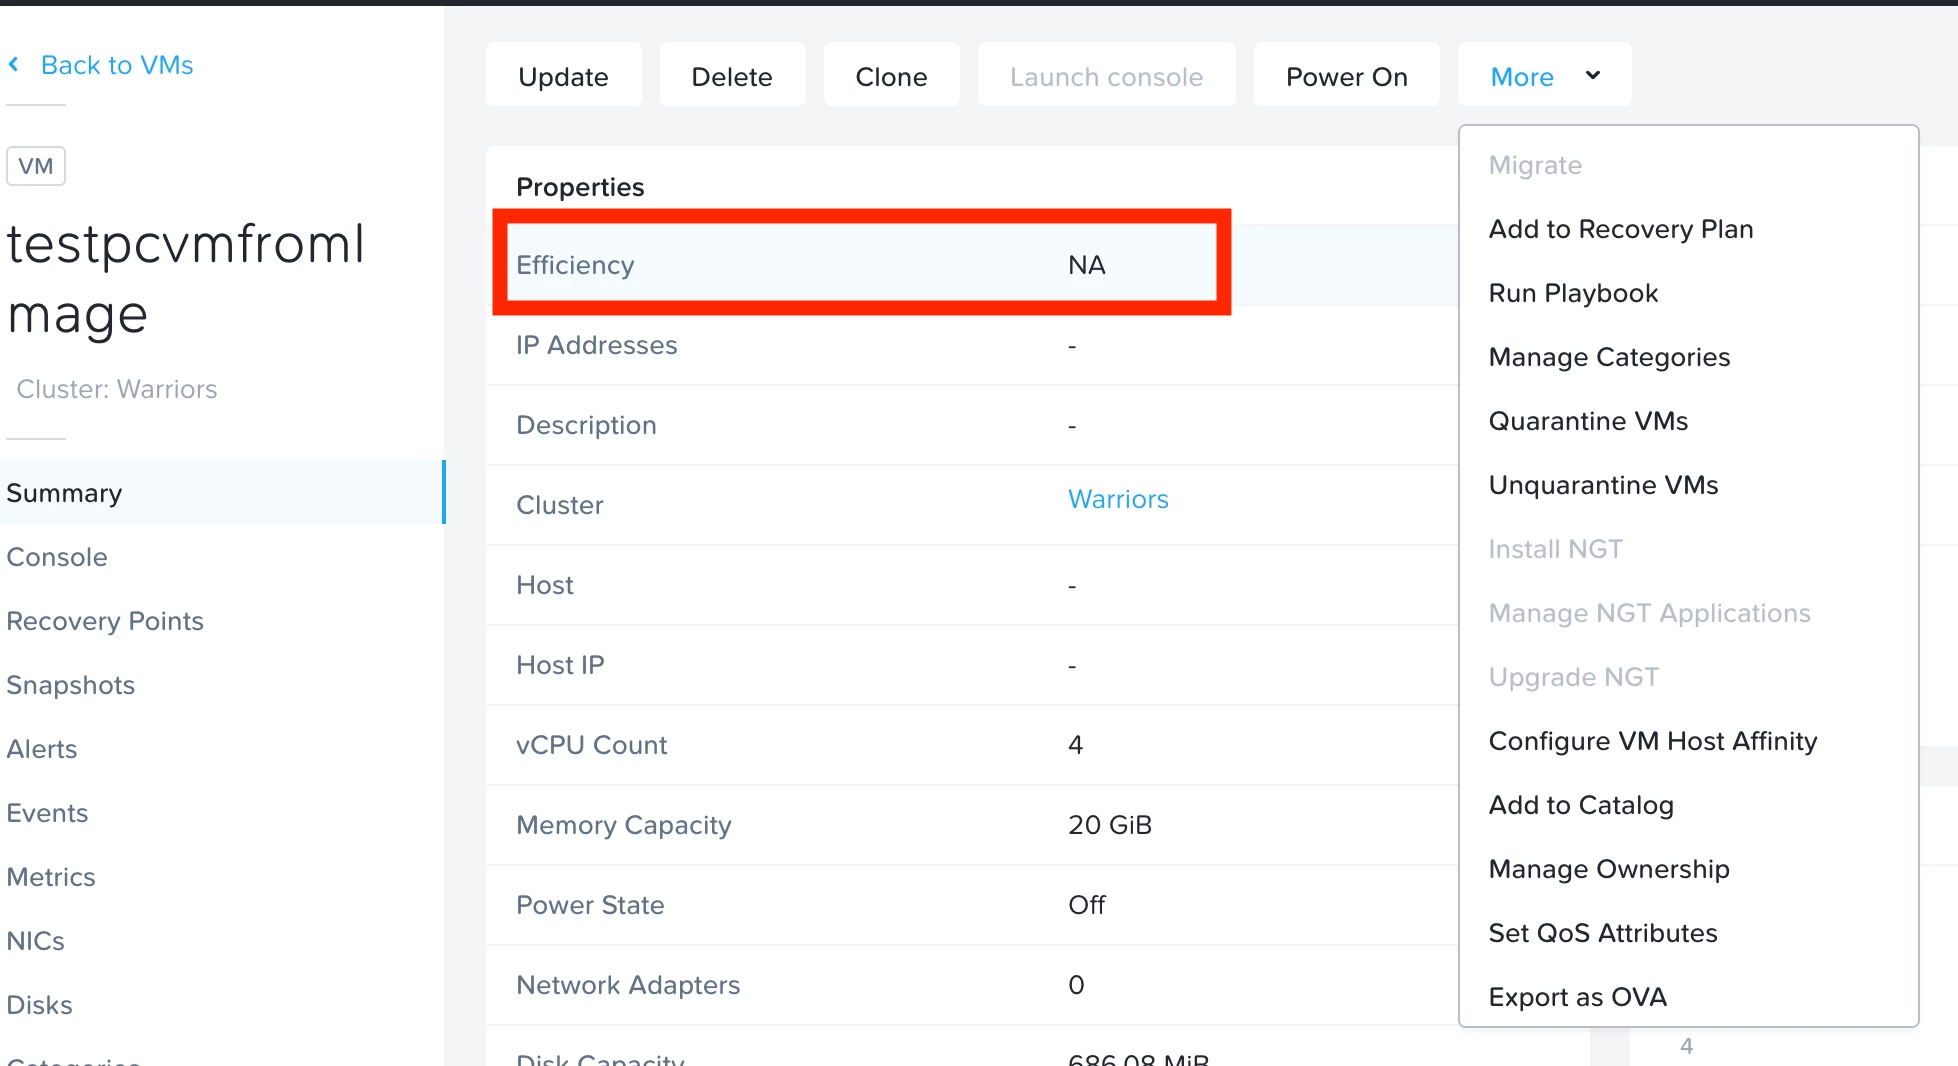
On Prism Central, to access the details page for a VM, go to the VMs List tab and click the VM name.
The VM name and the following set of tabs appear on the left:
Summary
Console
Data Protection
Alerts
Events
Metrics
NICs
Disks
Snapshots
Categories.
Click the Summary tab to display the information on the right.
The VM Efficiency Parameter displays the efficiency state for the selected VM.
If the efficiency is not good, an additional field may appear that specifies the problem. For example, if the VM is constrained, a Constrained field appears that identifies the constrained resource such as the CPU or memory.
The below values are seen for VM Efficiency:
Bully
Over Provisioned
Constrained
Inactive VM
Good
There is an additional value that may show up in VM efficiency - NA.
There are two cases where data might show up as NA :
-
At least 21 days of metrics are not present for us to create a baselining. Hence we cannot determine the efficiency of the VM.
-
We have exactly 21 days of data and the VM efficiency plugins have not executed yet. (They run once every 24 hrs). In this case, we should see the efficiency status within 24 hrs.

The NA value for VM Efficiency is currently not updated in the Portal Guide and a Documentation ENG is created for this - ENG-363250 , expected to be fixed in PC 5.18
Portal Documentation for reference: https://portal.nutanix.com/page/documents/details?targetId=Prism-Central-Guide-Prism-v5_19:mul-explore-vm-details-view-pc-r.html


