This article aims to better explain the nuances of the alert “Disk space usage for one or more disks on controller VM” as seen in Prism and I have included some basic troubleshooting steps to identify the exact issue.
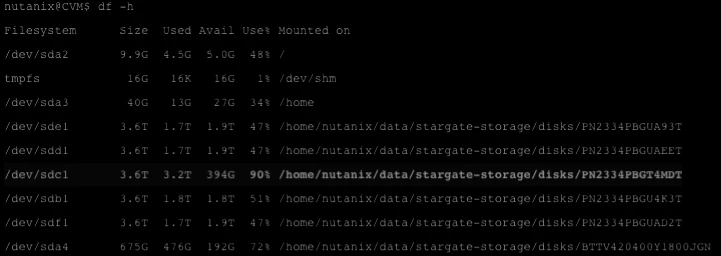
SSH into any CVM of the cluster and run the below command:
++ allssh “df -h”This will list the use % of all the disks controlled by the CVM.
For ex: see screenshot below
Nutanix reserves space in the SSD under /home for its infrastructure and is capped at 40GB, and sometimes it is possible to run low on the space usage and triggering an alert.
Check out this article for more information on how to reduce /home space usage.
The other disks /dev/sdx are the individual physical drives on each node. First we eliminate the possibility of a faulty drive by running a smartctl check.
++ sudo smartctl -a /dev/sdx Replace x with the appropriate disk name from df -h output.
If the smartctl test fails, then contact your vendor for disk replacement.
Back to the df -h output, the space usage % of these disks can give us more information about the alert.

-
Identify the SSD drives:
If the SSD drives are showing more the 95% usage, then this means that the rate of R/W IO is much faster than cold data tiering or some User VM is pinned to the Flash SSD tier via Prism.
Basically we need to look into possibly increasing the SSD disk size or check for any VM that have Flash mode ON that is hogging all the SSD disk space.
Engage Nutanix Support is such a case for further analysis or post your comments and output here for a chance for the community to chime in.
-
HDD drives use % gives us some additional info based on no of disks effected.
-
If all the disks show high % in one CVM, then curator service on this node might not be doing its job.
-
But If only one of the disk shows high use %, then, we need can check the contents of the disk itself to find the issue.
For More troubleshooting and resolution : See KB 3224 - Troubleshooting "Disk Space Usage High" alerts regarding HDD usage
-
Cluster Wide - high disk space usage seen:
In this case, alerts must be investigated as stargate stops writing data to a disk when the extent store on that disk is 95% full. When all the disks on a cluster hit 95% utilization, write operations from the hypervisor are rejected, which might result in VMs hanging.
The utilization of disk space is due to user data, which indicates the cluster is undersized with respect to storage capacity. It might also be due to various AOS related problems that require further troubleshooting.
Curator scans
Curator is responsible for a lot of things, but one of the main jobs it does is of garbage collection and clean up.
This makes curator responsible for reclaiming space on disks. If the curator scans don’t succeed, then there is a possibility of disk space not being reclaimed.
Say you delete a VM or a virtual disk, it is only marked for removal. The curator service purges the vdisk during Curator Partial scans or fulls scans.
Another scenario might be the result of snapshots not being deleted after DR sync replication by the curator scans.
Command to check the most recent Curator scans that ran in the Cluster:
++ curator_cli get_last_successful_scansIf there was no curator scan run in the last 6 hrs, please contact Nutanix Support
More about curator scans :
KB - 2101 Under what conditions do Curator scans run?
Some further troubleshooting steps to identify the reason for the alert :
++ ncli pd ls-snapsShows any snapshots that are expired but not yet deleted from the cluster
++ vdisk_config_printer | grep to_remove | wc -lChecks for vdisks marked for removal but has not yer been purged.
++ ncc health_checks hardware_checks disk_checks disk_usage_checkVerifies if any individual disk or Controller VM (CVM) system partition usage is sustained above a certain threshold.
For more information on curator scans: KB-1523


