Hello everyone,
I have a question concerning the analysis tab on the Prism Element UI.
To get started i will shortly explain what our current situation is:
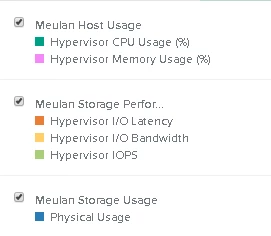
Last year we sold some Nutanix boxes to a customer. In this contract we also included monitor/management services. As an agreement, every month we schedule a meeting with our customer where we evaluate performance of the nutanix clusters. There are 3 main fields we focus on during the meeting; Cluster host usage, storage performance and storage usage. (See picture below)
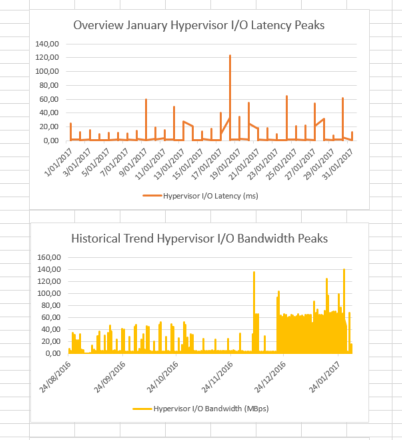
In this report we include all the data we extracted from the analysis tab on Prism Element. We import this data into excel and pour that data into graphs. (See picture below).
This is where our problems arise.
As you can see we need both monthly & lifetime graphs from our data. In order to get to this graph we have to:
-export the data from Prism Element
*You cannot select begin & enddate so after we export we have to manually trim the data to our needs and import this from one excel to another which takes a massive amount of time to do.
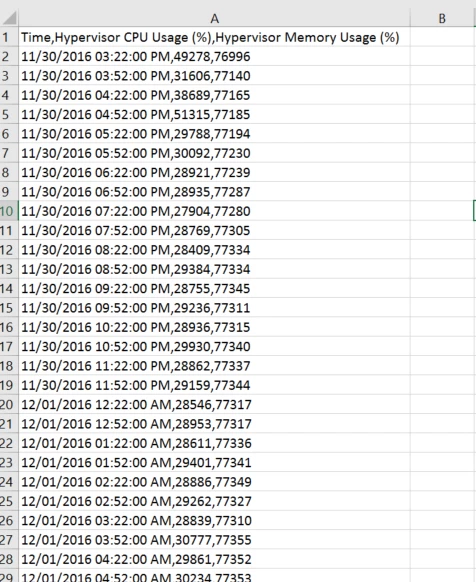
Picture of raw data from an exported .csv file:
*The date format in the raw data is not compatible with excel, so we have convert the dates to another format.
*We need our data in Percentile and we also need daily averages for every last month.
*For latency, throughput and bandwidth we also need to format the data in excel to get the
graphs.
Conclusion: As you can see we need to invest huge amounts of time into something that should be simple out of the box. Especially when you already have an implemented analysis tab.
So does anyone here has experienced the same problem?
Is there a possible solution to this?
Maybe utilizing Rest API's?
Thanks in advance!
Seba
Page 1 / 1
Hi sverhoevne,
Thanks for bringing this up. The best way to extract a certain range of data is probably through the REST API. The API allows you to specifies the start time and end time of the stats you are pulling.
Hello harryhy
Thanks for the fast reply.
We are aware that you can do this through REST API.
How to exactly do this is another matter..
Can you elaborate or are there guides available?
Thanks in advance
Seba
Thanks for the fast reply.
We are aware that you can do this through REST API.
How to exactly do this is another matter..
Can you elaborate or are there guides available?
Thanks in advance
Seba
Hi sverhoevne,
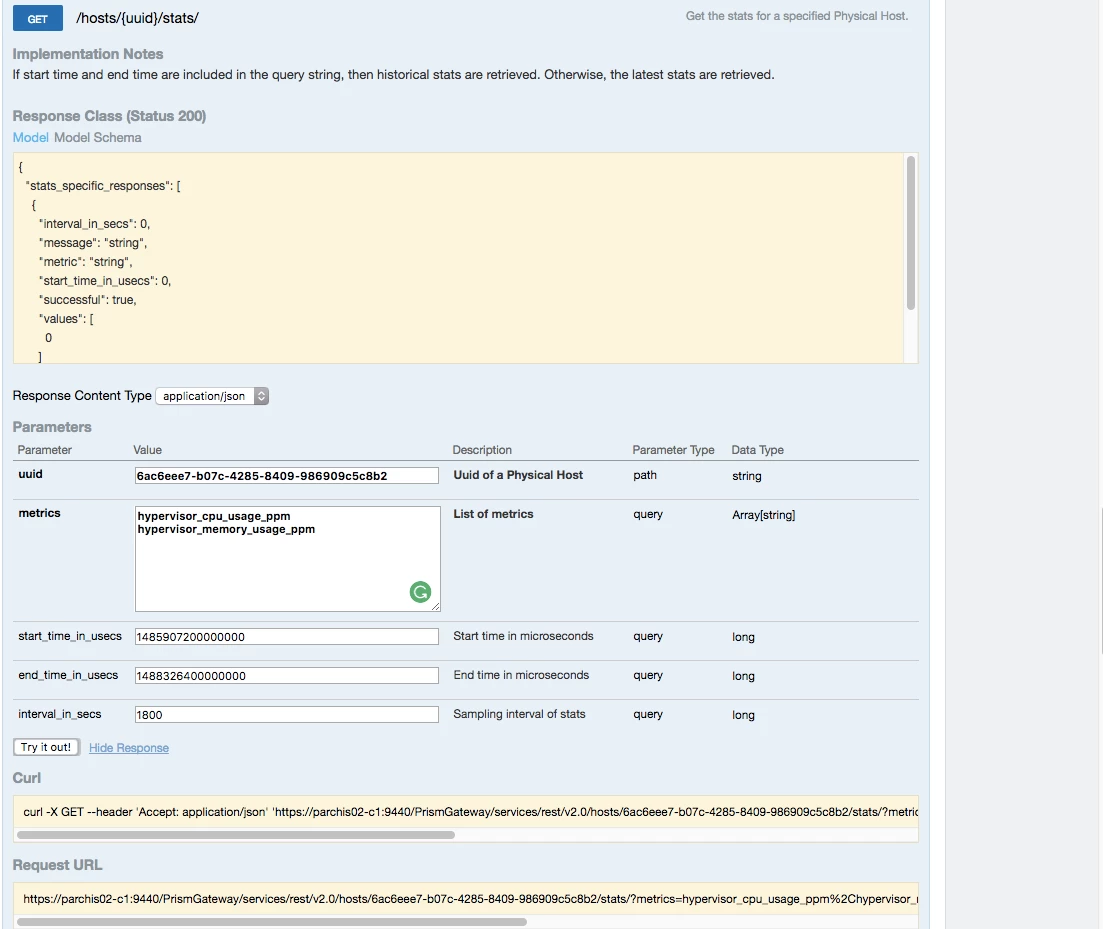
For example, you can use /cluster/stats to get those stats with defined start and end time. Please see the screenshot below.
harryhy
Thanks for the response.
I don't really know how to get started with that. Can you give an example how to get a report from february 1st to the 28th? I don't really see how you can do this with the commands: "Starttime in µseconds", "endtime in µseconds"...
Sebastiaan
Thanks for the response.
I don't really know how to get started with that. Can you give an example how to get a report from february 1st to the 28th? I don't really see how you can do this with the commands: "Starttime in µseconds", "endtime in µseconds"...
Sebastiaan
Hi sverhoevne,
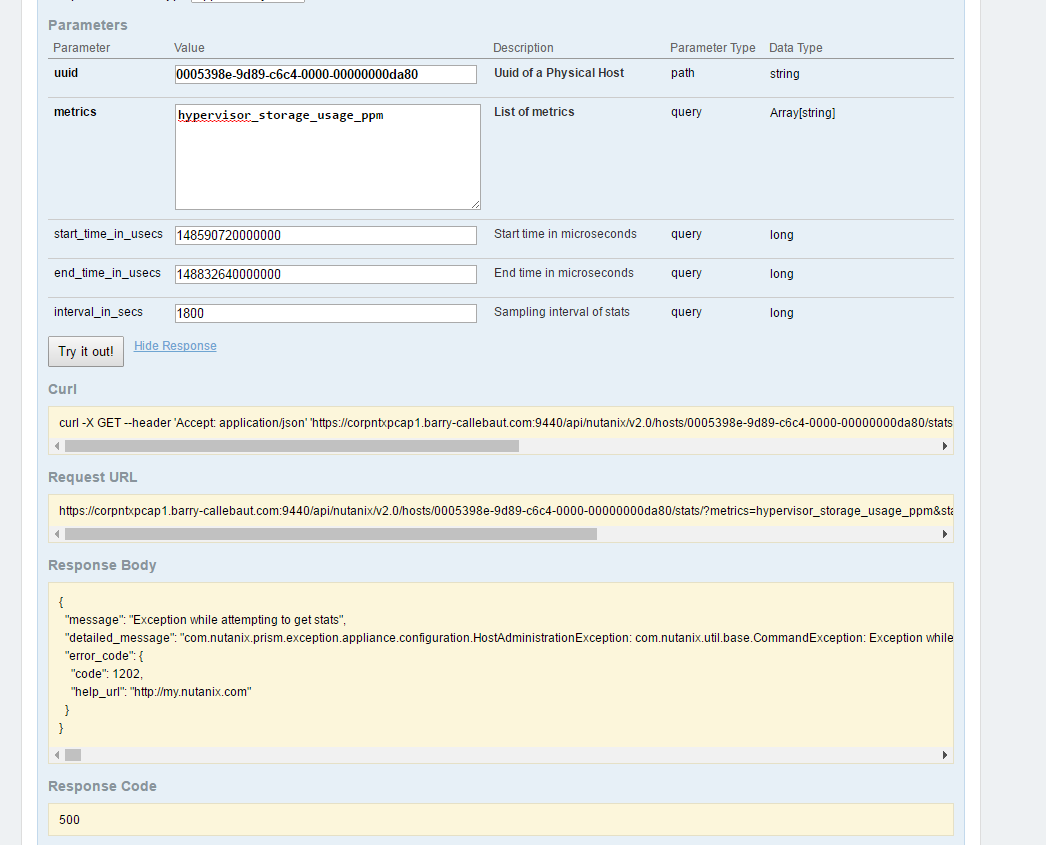
Here is the screenshot of the example of extract the cpu and memory usage from Feb 1, 2017 to Feb 28, 2017 with the interval of 30 minutes. The star_time and end_time is the epoch time is microseconds. In this case, the start_time is 1485907200000000 and the end_time is 1488326400000000. You can refer to https://www.epochconverter.com for the conversion and language-specific functions.
Hey harryhy
I tried this but it returns an error.. I also tried to use the body in Powershell but I don't really undertstand what
stats_specific_responses & values should have filled in..?
Seba
I tried this but it returns an error.. I also tried to use the body in Powershell but I don't really undertstand what
stats_specific_responses & values should have filled in..?
Seba
sverhoevne
Please try the below script.
https://github.com/sandeepmp/nutanix/blob/master/Cluster-Report-NTNX.Ps1
Regards,
Sandeep MP
Please try the below script.
https://github.com/sandeepmp/nutanix/blob/master/Cluster-Report-NTNX.Ps1
Regards,
Sandeep MP
Hey sandeepmp
I have some issues with the script..
Is there some way I can contact you for this?
Regards
Seba
I have some issues with the script..
Is there some way I can contact you for this?
Regards
Seba
sverhoevneCurrently I am on vacation and will back on 3rd May.You can contact me on below.Email : sandeep.mp@nutanix.con
Hey Sandeep,
Is it possible to extract multiple metrics into 1 csv file?
Seba
Is it possible to extract multiple metrics into 1 csv file?
Seba
sverhoevne
Try below
################################################################ Function: Cluster-Report-NTNX## Author: Sandeep MP## Description: Gather Cluster stats and exports to mentioned path## Language: PowerShell##############################################################
function Cluster-Report-NTNX{param([Parameter(Position=0,Mandatory=$True)][String]$Server,[Parameter(Mandatory=$True)][String]$UserName,[Parameter(Mandatory=$True)][String]$Password,[Parameter(Mandatory=$True)][DateTime]$Startdate,[Parameter(Mandatory=$True)][DateTime]$Enddate,[Parameter(Mandatory=$True)][Int]$Interval,[Parameter(Mandatory=$True)][String]$OutFile)Begin{#Add NutanixCMDletsPSSnapinAdd-PSSnapin NutanixCMDletsPSSnapin
#Prerequisites Check$pssnapin = Get-PSSnapin$pssnapincheck = $pssnapin.name -contains "NutanixCMDletsPSSnapin"$psver = $PSVersionTable.PSVersion.Major -ge 3if(($pssnapincheck -eq $false) -or ($psver -eq $false)){
if($pssnapincheck -eq $false){write-host "Nutanix CMDlets not installed"}if($psver -eq $false){write-host "Powershell version should be 3.0 or above"}break}$pwd = ConvertTo-SecureString $password -AsPlainText -Force$data = @()$epoch = Get-Date -Date "01/01/1970"[int64]$start_time = ((New-TimeSpan -Start $epoch -End $startdate).TotalMilliseconds)*1000[int64]$end_time = ((New-TimeSpan -Start $epoch -End $enddate).TotalMilliseconds)*1000}process{Disconnect-NTNXCluster -Servers *$clusterout = Connect-NTNXCluster -Server $server -UserName $UserName -Password $pwd -AcceptInvalidSSLCerts -ForcedConnection$hypervisor_cpu_usage_ppm =""$hypervisor_memory_usage_ppm =""$hypervisor_avg_io_latency_usecs = ""$hypervisor_io_bandwidth_kBps =""$hypervisor_num_iops =""$storage_usage_bytes =""$hypervisor_cpu_usage_ppm = (Get-NTNXClusterStat -Metrics "hypervisor_cpu_usage_ppm" -StartTimeInUsecs $start_time -EndTimeInUsecs $end_time -IntervalInSecs $Interval).values$hypervisor_memory_usage_ppm = (Get-NTNXClusterStat -Metrics "hypervisor_memory_usage_ppm" -StartTimeInUsecs $start_time -EndTimeInUsecs $end_time -IntervalInSecs $Interval).values$hypervisor_avg_io_latency_usecs = (Get-NTNXClusterStat -Metrics "hypervisor_avg_io_latency_usecs" -StartTimeInUsecs $start_time -EndTimeInUsecs $end_time -IntervalInSecs $Interval).values$hypervisor_io_bandwidth_kBps = (Get-NTNXClusterStat -Metrics "hypervisor_io_bandwidth_kBps" -StartTimeInUsecs $start_time -EndTimeInUsecs $end_time -IntervalInSecs $Interval).values$hypervisor_num_iops = (Get-NTNXClusterStat -Metrics "hypervisor_num_iops" -StartTimeInUsecs $start_time -EndTimeInUsecs $end_time -IntervalInSecs $Interval).values$storage_usage_bytes = (Get-NTNXClusterStat -Metrics "storage.usage_bytes" -StartTimeInUsecs $start_time -EndTimeInUsecs $end_time -IntervalInSecs $Interval).values
for($i =0;$i -lt $hypervisor_cpu_usage_ppm.count;$i++){$into = new-object PSObjectAdd-member -inputobject $into -membertype Noteproperty -Name Date $startdateAdd-member -inputobject $into -membertype Noteproperty -Name hypervisor_cpu_usage_ppm $hypervisor_cpu_usage_ppm[$i]Add-member -inputobject $into -membertype Noteproperty -Name hypervisor_memory_usage_ppm $hypervisor_memory_usage_ppm[$i]Add-member -inputobject $into -membertype Noteproperty -Name hypervisor_avg_io_latency_usecs $hypervisor_avg_io_latency_usecs[$i]Add-member -inputobject $into -membertype Noteproperty -Name hypervisor_io_bandwidth_kBps $hypervisor_io_bandwidth_kBps[$i]Add-member -inputobject $into -membertype Noteproperty -Name hypervisor_num_iops $hypervisor_num_iops[$i]Add-member -inputobject $into -membertype Noteproperty -Name storage_usage_bytes $storage_usage_bytes[$i]$data +=$into
$Startdate = $startdate.AddSeconds($Interval)}
}End{if($out){$data | export-csv $OutFileWrite-Host "Report saved in path : $OutFile"}Else{Write-Host "No data available for export"}Disconnect-NTNXCluster -Servers *}}
Thanks alot!
So this script puts all metrics into one csv or am I able to choose which metric to combine into the same CSV?
Seba
So this script puts all metrics into one csv or am I able to choose which metric to combine into the same CSV?
Seba
sandeepmp
Hey sandeep, thanks for all the help so far.
What i'm actually trying to achieve is:
-When you pass the parameters, is it possible to pass multiple metrics so they all import into the same CSV file?
For example:
Cluster-Report-NTNX -Server X.X.X.X -UserName username -Password pasword- -Startdate ‘06/01/2017 01:00’ -Enddate ‘06/30/2017 18:00’ -Interval '1800' -OutFile 'c:Filename.csv' -Metric 'Hypervisor CPU Usage (%)', 'Hypervisor Memory Usage (%)'
Enter your E-mail address. We'll send you an e-mail with instructions to reset your password.