FIO Test

  • 4 April 2014
  • 5 replies
  • 1774 views

Badge +5


Does anyone test Nutanix with FIO but not with diagnostics VM?
When we testing Nutanix our processors on host all cores are almost 100 % loaded.
We started test 3.5.2.1 and get some disks maked offline, we return them and upgrade to 3.5.3.1.
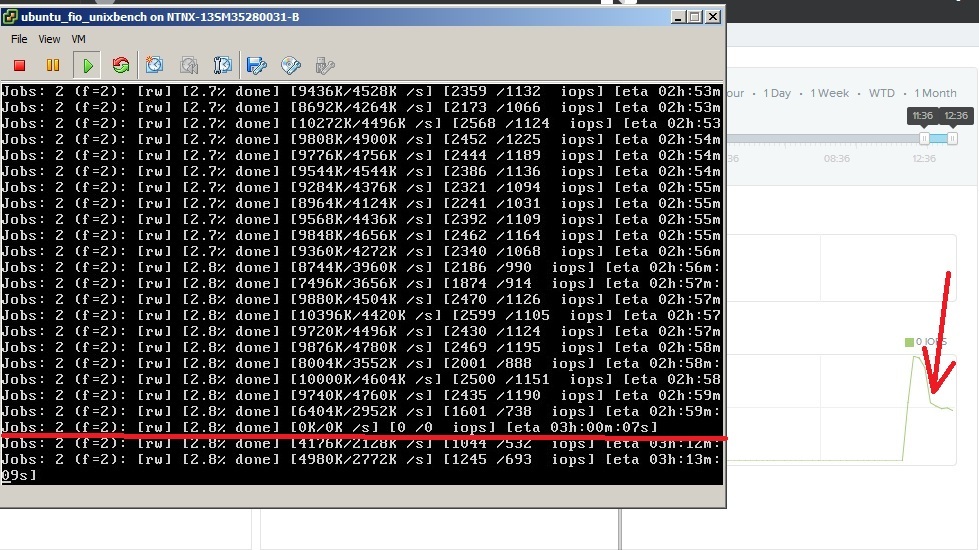
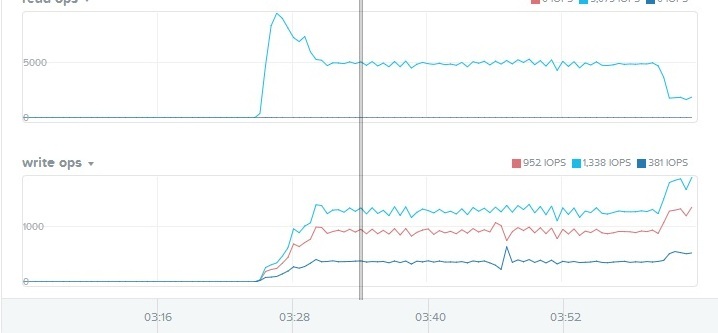
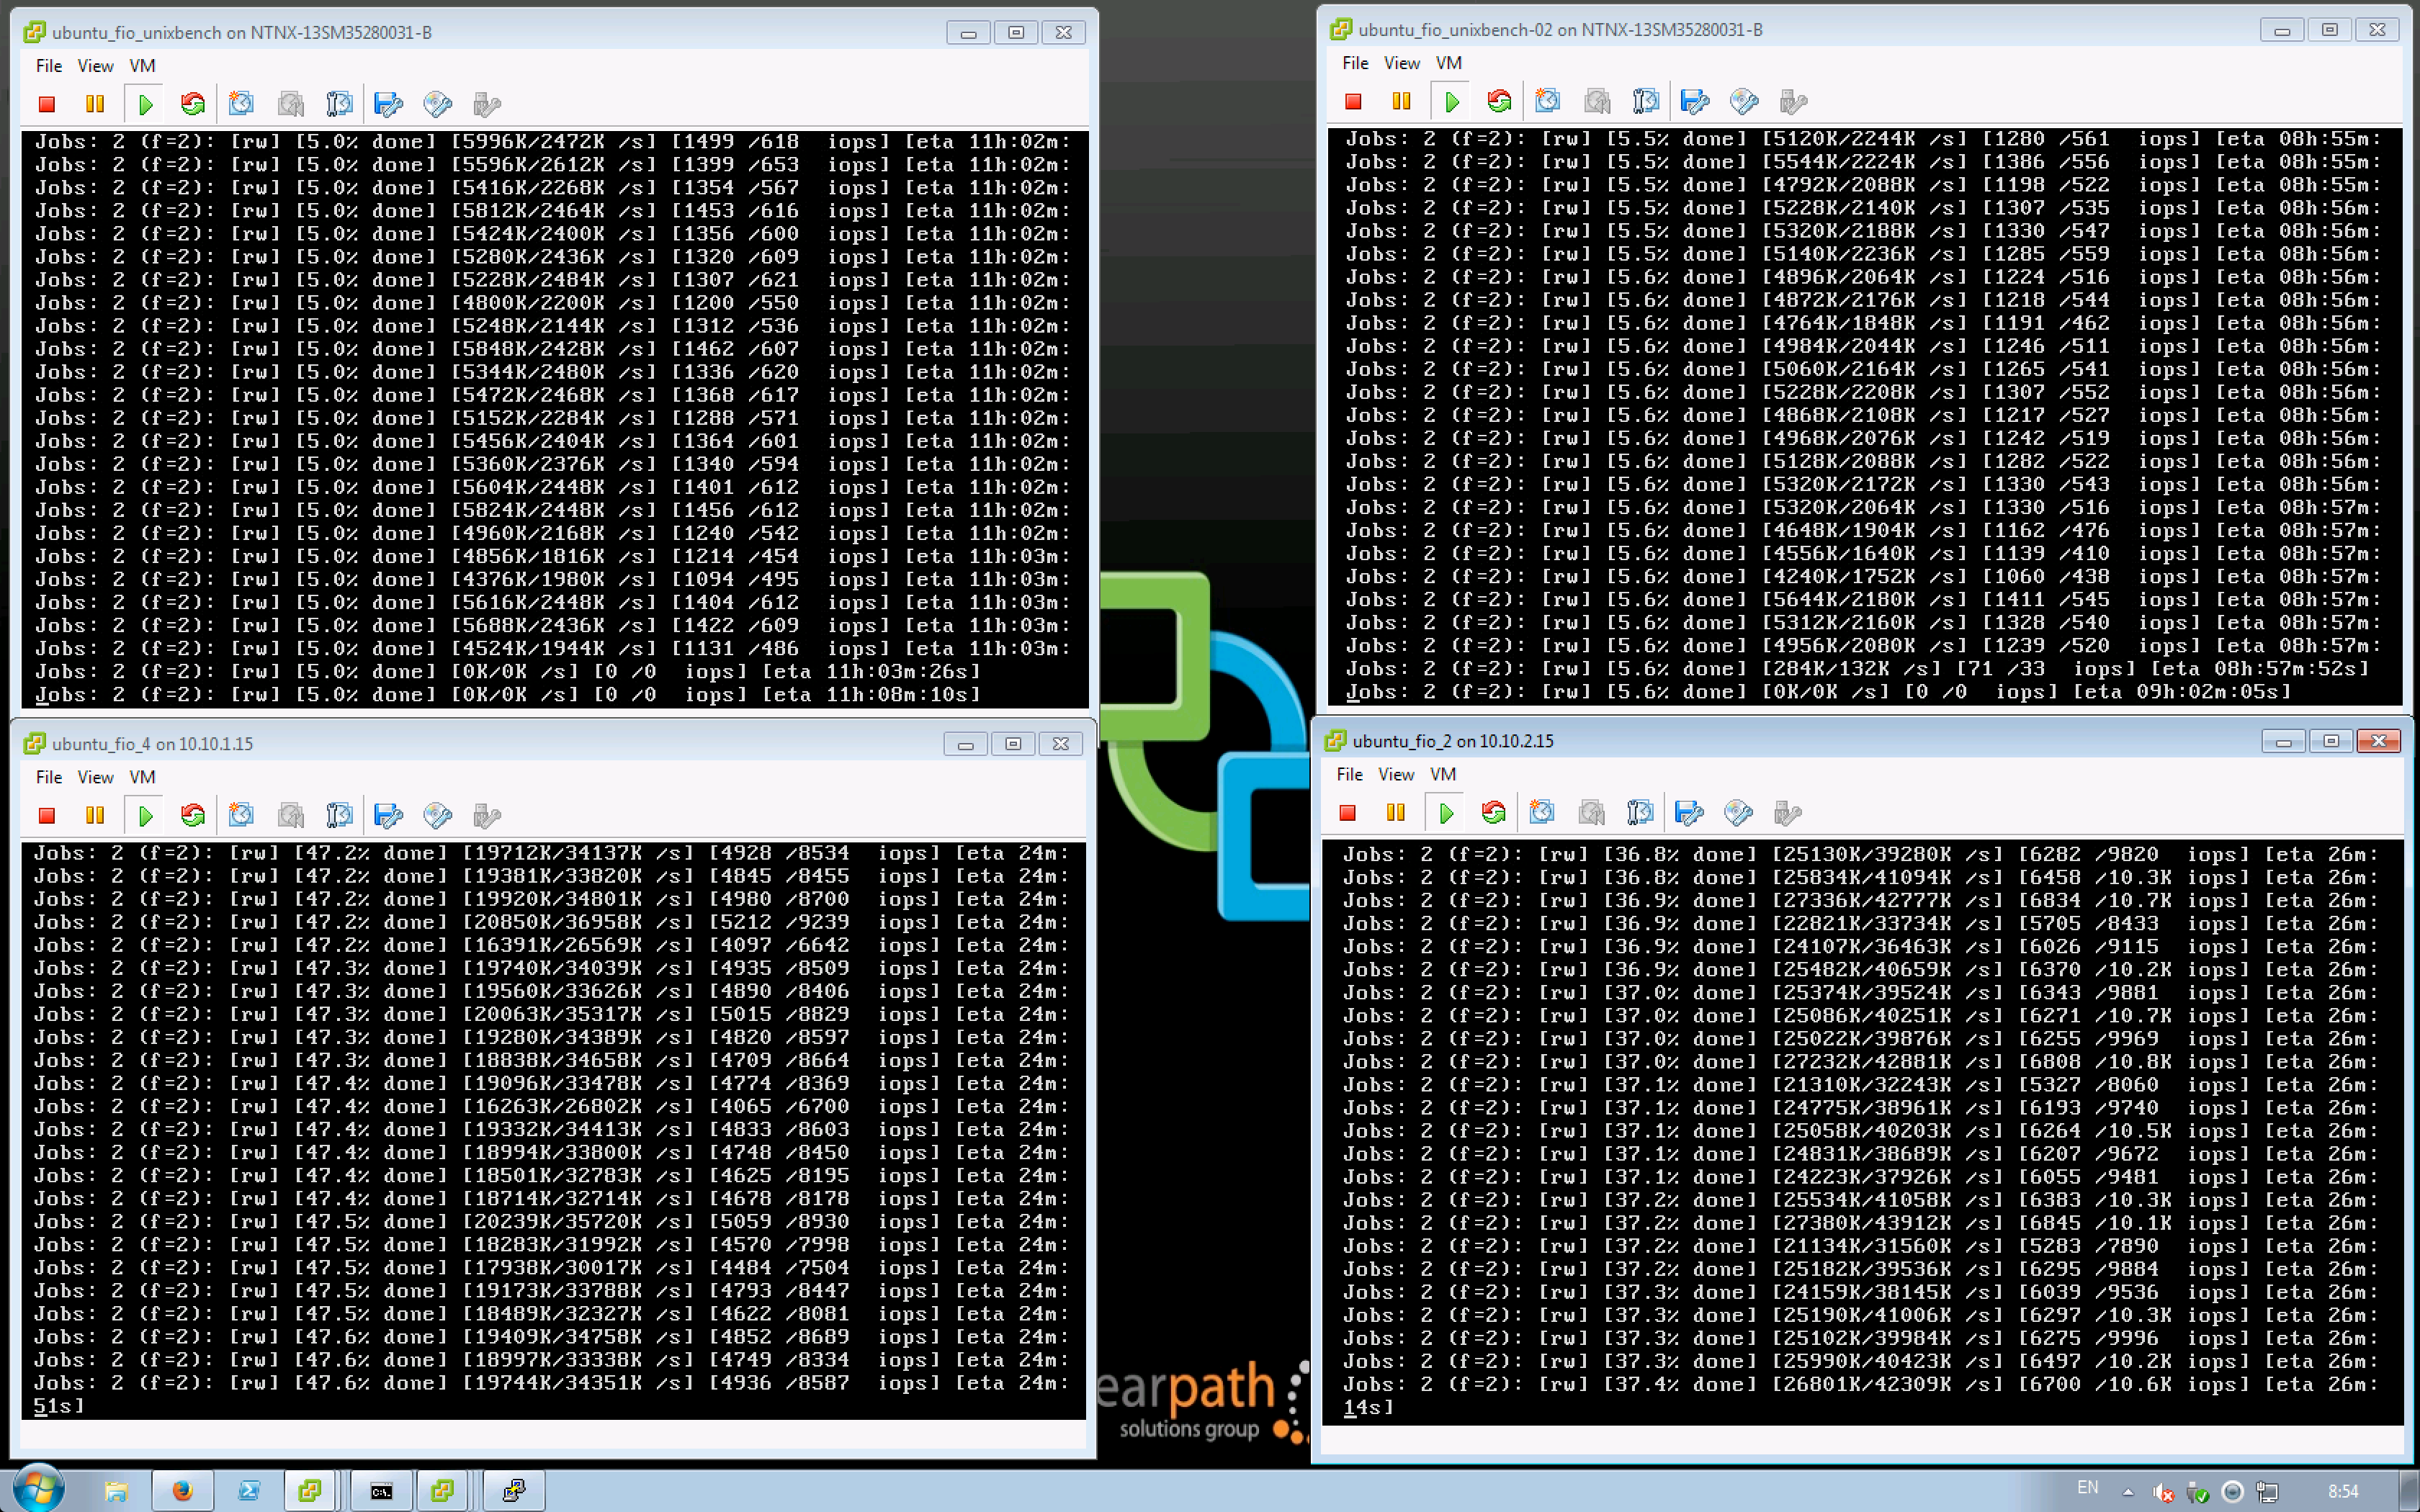
For the first time after install results is ok (13k IOPS for 400 Gb disk on 3350), but next day (all data is cold) we have afwul resuls with zero counters sometimes.For example 0 read/0 write. Nutanix is upper consoles on slide.
Does it normal resuls?
ncc check tell that everything is ok.
For test on slide we use 100Gb disk so we should be in one node.
Fio config
>sudo fio read_config.ini
root@debian:~# cat test_vmtools.ini
[readtest]
blocksize=4k
filename=/dev/sdb
rw=randread
direct=1
buffered=0
ioengine=libaio
iodepth=32

>sudo fio write_config.ini
root@debian:~# cat test_vmtools.ini
[writetest]
blocksize=4k
filename=/dev/sdb
rw=randwrite
direct=1
buffered=0
ioengine=libaio
iodepth=32

>sudo fio rw_config.ini
root@debian:~# cat test_vmtools.ini
[readtest]
blocksize=4k
filename=/dev/sdb
rw=randread
direct=1
buffered=0
ioengine=libaio
iodepth=32
[writetest]
blocksize=4k
filename=/dev/sdb
rw=randwrite
direct=1
buffered=0
ioengine=libaio
iodepth=32

Could anyone help me with test?

This topic has been closed for comments

5 replies

Userlevel 1
Badge +4
Hi,

We run fio outside of diagnostics VM quite frequently in the Nutanix performance labs. The fact that you're getting Zero IO's during the test indicates that something is wrong in the cluster. Pleas e open a support case so that we can figure out what's going on.

-Gary.
Badge +5
Ncc check say that everything is OK.

High Performance for 5-10 min, then degraded performance.
Diagnostics VMs get high performance but they run only fo 5 min...


From diagnostics VMs:
Waiting for the hot cache to flush ........................ done.
Running test 'Random read IOPS' ...
Begin fio_rand_read: Sat Mar 29 22:02:25 2014

49495 IOPS
End fio_rand_read: Sat Mar 29 22:04:08 2014

Duration fio_rand_read : 103 secs
*******************************************************************************

Waiting for the hot cache to flush ... done.
Running test 'Random write IOPS' ...
Begin fio_rand_write: Sat Mar 29 22:04:11 2014

26559 IOPS
End fio_rand_write: Sat Mar 29 22:05:54 2014

Duration fio_rand_write : 103 secs
Userlevel 2
Badge +13
How many VMDK disks per VM? If only one you probably are hitting our oplog limit per vdisk.

Try creating multiple disks and see if that extends the time before degredation.

Thanks,
Badge +5
There were two main problems:
1. our test was incorrect - in Nutanix we cann't give all IOPS only to one VM, we should use multiple VMs with own disk.
One VM: 2000 read/500 write in VM and on hosts
Two VMs:2500read/750 write in VMs and 5000/1500 on host
So if we want to test Nutanix storage performance we should use many VMs.
2. during tests stargate process crash due to an issue with out of memory and all requests were redirected to another CVM.
Nutanix engineer help us with gflags.
There is no solution in the code yet and the fix is planned for 3.5.5 and 4.0.
Now we don't see 0 read and write.
before:


after:


How should I test to understand what performance I can get per VM not whole cluster?
If we are takling about service provider with vCloud Director how we can guarantee IOPS per VM and write it in SLA? SCIOC and manually per VM IOPS?
Userlevel 4
Badge +19
You can test with FIO or IOMeter, if your use case is 1VM and 1 vdisk make sure to bump up the outstanding IO. No system will peform great with outstanding IO of 1.

Since Nutanix has local storage controllers on each node you can use disk limitsshares to guartnee resources.
http://itbloodpressure.com/2013/12/02/data-locality-sql-vdi-on-the-same-nutanix-cluster/

Also you could try IOAnalyzer too, they have some pre-configured workloads, not sure if it matches what your doing or not though.