MONITORING Part 3/4 Metrics and Prometheus and Grafana

  • 6 October 2020
  • 3 replies
  • 5937 views

Userlevel 2
Badge +12

Beside the “classical” Monitoring with snmp or agent based version now we are talking about Metrics and the Monitorng of LiveData with the OpenSource Project Prometheus. The Virtualization is made with the powerfull Tool of Grafana.

The access to the Data will be made with so called “Node-Exporter” which could we found under GitHUB. One is present for Nutanix!


My Testcase in the homelab is build with the following items:

NutanixCluster <- Prometheus <- Grafana

192.168.10.80 192.168.10.123 192.168.10.100

Nutanix CE Ubuntu 18.04 LTS Ubuntu 18.04 LTS

Prometheus 2.2.1 Grafana 7.0.4

GO 1.10

Requirements

  1. Create NEW User in Nutanix Prism Central with VIEWER Rights

2. Installation of Prometheus on Ubuntu 18.04 LTS with running GO!

Good Sourcse will be available here or here.

3. Installation ofvon Grafana 7.x on a second Ubuntun 18.04 LTS

Good Source are found here.


Start of Connection to Nutanix

  1. We download the GO Binary for the Nutanix Exporter to the Prometheus VM in the folder of GO/BIN

We will test the go/bin share with the --help command:

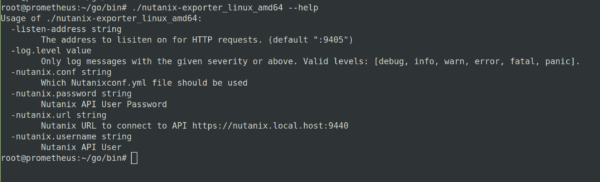
SO is should be. No we try to check if our new created VIEWER User is able to feth some metrics from the nutanix cluster. If we describe no seperate port Prometheus is using port 9405. If you are connection to more then one cluster you have to describe for each cluster a seperate port!


You could connect via IP or create an DNS Entry for it. Username/Password could be masked in variables if needed!

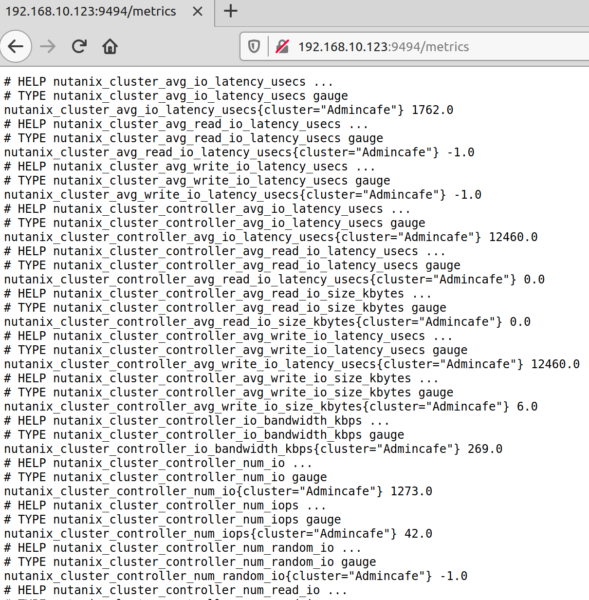
The Result on Port :9494 on our Prometheus Server is as follows: 

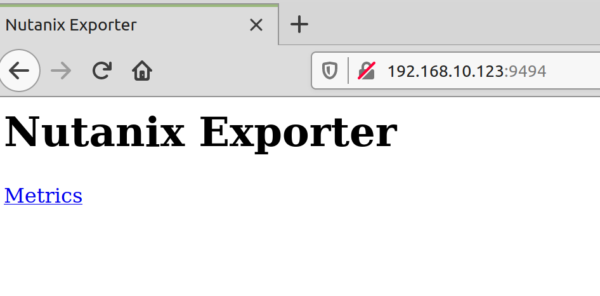
BINGO. With a click on Metric you get all Metrics which are available...

THIS was the manuell way.

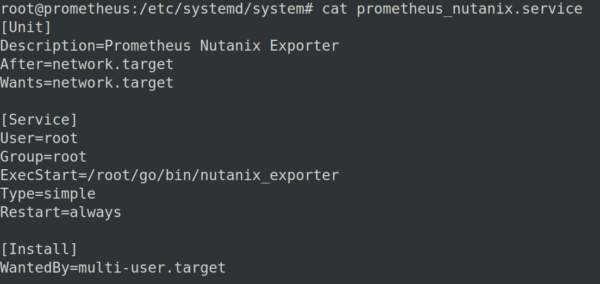
Now we build a little shell script which is doing these call automatically. We also create a Service on the prometheus server to be reboot aware!

We create the Shell Script  in /etc/systemd/system as a new SERVICE!

  1. Bash-Script will be created in the share of  /go/bin (Example Code)
Other Example could we found in the Github Repo!

2. Creation of a new Service in /etc/systemd/system

In my Homelab i used a root user! Dont do that in a production environment! Create a specific user for these task!

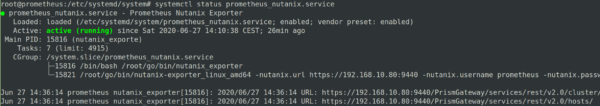
Enable the service with “systemctl enable prometheus_nutanix.service”

We reboot the VM and check if all is fine and running automatically now:

systemctl status prometheus_nutanix.service 

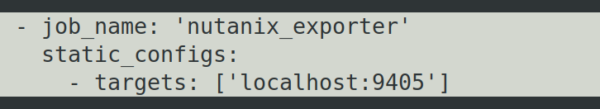
We will find the Metrics now on the give :port on the Prometheus. But for the work with Grafana the Exporter needs to be declared as a TARGET !

Modify /etc/prometheus/prometheus.yml and put in the following section! Restart the Prometheus Service!

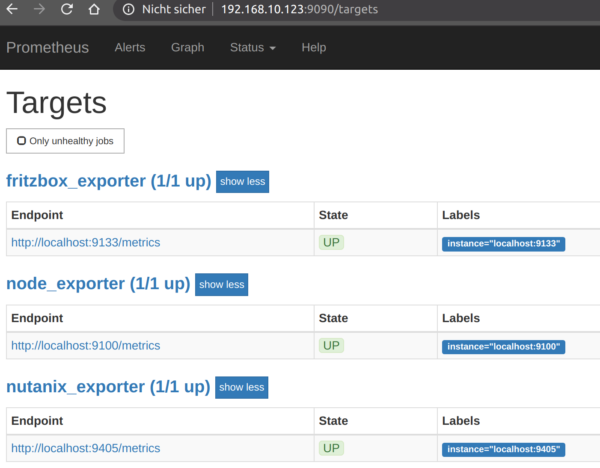
Controll the default Prometheus on Port :9090 if the new created TARGET is present and working.

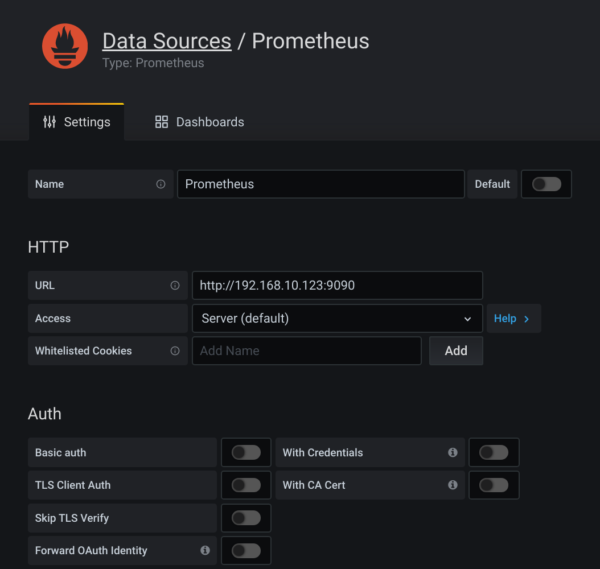
Fine! Now we switch over to GRAFANA

  1. We declare Prometheus as a new Datasource in Grafana
Just use the PrometheusIP with the  Default Port 9090!

Now we created a new Dashboard and select METRICS under Prometheus/Nutanix.(btw. Exportername from the Prometheus Config)

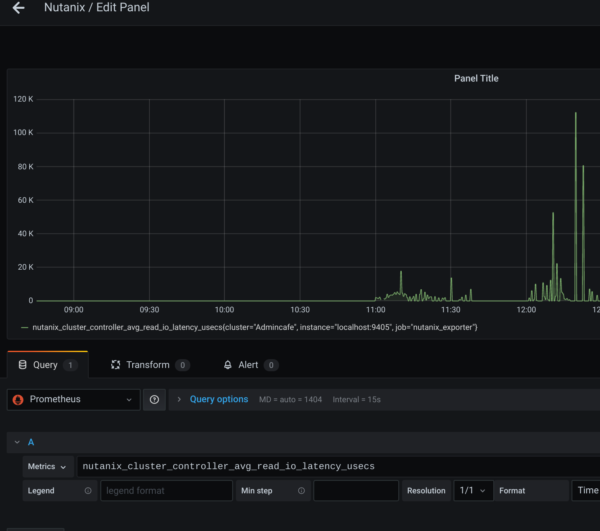
Attention! It makes sence to declare EACH Cluster with a valid NAME in the Prometheus Config!

I created just a simple Example Dashboard with VM Account, Memory etc.

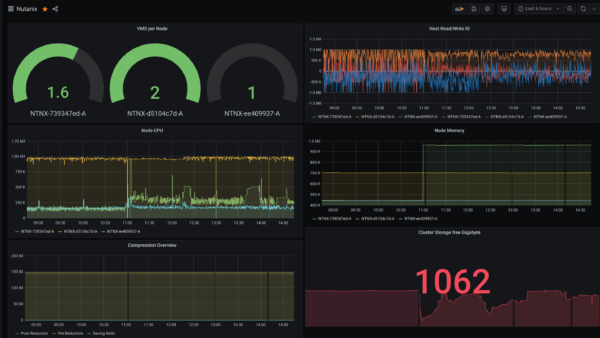
If you like to start with that just download the JSON File from my Github Repo here and import it as a new Dashboard.

Handling Tips:

Export all Metrics from the Prometheus Metrics Site to Notepad++ / Sublime for easy searching!


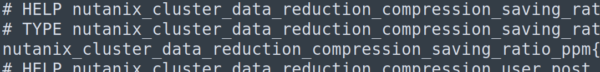
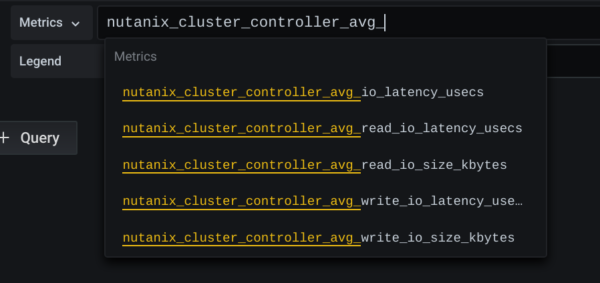
The Values behind HELP and TYPE are irrelevant. But the NAME of the Metrik is key! Copy and Paste it from here to the selection in Grafana!


The LEGENDS show in default the NAME of the Metric. But you could

a) manuell overwrite it

b) Use Variable like  {{cluster}} or {{node}}

  1. Convert BYTES via /1024/1024/1024 etc. in MB/GB/TB 


Have Fun with your Dashboards…….


This topic has been closed for comments

3 replies

Badge

Thanks for the documentation. Do we have documentation which explain these metrics? And what ideally should be the threshold set up for them? 

Userlevel 2
Badge +12

If you look on the metrics the most declarations are clear. It is also a missing element in the nutanix bible...but i hope it will take part there soon… here is an example out of my homelab 3 Node Cluster…

nutanix_cluster_num_random_io{cluster="Admincafe"} -1.0
nutanix_cluster_num_read_iops{cluster="Admincafe"} 3.0
nutanix_cluster_num_read_io{cluster="Admincafe"} 93.0
nutanix_cluster_num_seq_io{cluster="Admincafe"} -1.0
nutanix_cluster_num_write_iops{cluster="Admincafe"} 7.0
nutanix_cluster_num_write_io{cluster="Admincafe"} 212.0
nutanix_cluster_random_io_ppm{cluster="Admincafe"} -1.0
nutanix_cluster_read_io_bandwidth_kbps{cluster="Admincafe"} 29.0
nutanix_cluster_read_io_ppm{cluster="Admincafe"} 304918.0
nutanix_cluster_seq_io_ppm{cluster="Admincafe"} -1.0
nutanix_cluster_storage_capacity_bytes{cluster="Admincafe"} 1.283931572427e+12
nutanix_cluster_storage_disk_physical_usage_bytes{cluster="Admincafe"} 0.0
nutanix_cluster_storage_free_bytes{cluster="Admincafe"} 1.145171744971e+12
nutanix_cluster_storage_logical_usage_bytes{cluster="Admincafe"} 1.45839423488e+11
nutanix_cluster_storage_reserved_capacity_bytes{cluster="Admincafe"} 0.0
nutanix_cluster_storage_reserved_free_bytes{cluster="Admincafe"} 0.0
nutanix_cluster_storage_reserved_usage_bytes{cluster="Admincafe"} 0.0
nutanix_cluster_storage_tier_das_sata_usage_bytes{cluster="Admincafe"} 0.0
nutanix_cluster_storage_tier_ssd_usage_bytes{cluster="Admincafe"} 1.39058477856e+11
nutanix_cluster_storage_unreserved_capacity_bytes{cluster="Admincafe"} 0.0
nutanix_cluster_storage_unreserved_free_bytes{cluster="Admincafe"} 0.0
nutanix_cluster_storage_unreserved_own_usage_bytes{cluster="Admincafe"} 0.0
nutanix_cluster_storage_unreserved_usage_bytes{cluster="Admincafe"} 0.0
nutanix_cluster_storage_usage_bytes{cluster="Admincafe"} 1.38759827456e+11
nutanix_cluster_storage_user_capacity_bytes{cluster="Admincafe"} 0.0
nutanix_cluster_storage_user_container_own_usage_bytes{cluster="Admincafe"} 0.0
nutanix_cluster_storage_user_disk_physical_usage_bytes{cluster="Admincafe"} 0.0
nutanix_cluster_storage_user_free_bytes{cluster="Admincafe"} 0.0
nutanix_cluster_storage_user_other_containers_reserved_capacity_bytes{cluster="Admincafe"} 0.0
nutanix_cluster_storage_user_reserved_capacity_bytes{cluster="Admincafe"} 0.0
nutanix_cluster_storage_user_reserved_free_bytes{cluster="Admincafe"} 0.0
nutanix_cluster_storage_user_reserved_usage_bytes{cluster="Admincafe"} 0.0
nutanix_cluster_storage_user_storage_pool_capacity_bytes{cluster="Admincafe"} 0.0
nutanix_cluster_storage_user_unreserved_capacity_bytes{cluster="Admincafe"} 0.0
nutanix_cluster_storage_user_unreserved_free_bytes{cluster="Admincafe"} 0.0
nutanix_cluster_storage_user_unreserved_own_usage_bytes{cluster="Admincafe"} 0.0
nutanix_cluster_storage_user_unreserved_shared_usage_bytes{cluster="Admincafe"} 0.0
nutanix_cluster_storage_user_unreserved_usage_bytes{cluster="Admincafe"} 0.0
nutanix_cluster_storage_user_usage_bytes{cluster="Admincafe"} 0.0
nutanix_cluster_timespan_usecs{cluster="Admincafe"} 3e+07
nutanix_cluster_total_io_size_kbytes{cluster="Admincafe"} 4013.0
nutanix_cluster_total_io_time_usecs{cluster="Admincafe"} 62667.0
nutanix_cluster_total_read_io_size_kbytes{cluster="Admincafe"} 889.0
nutanix_cluster_total_read_io_time_usecs{cluster="Admincafe"} -1.0
nutanix_cluster_total_transformed_usage_bytes{cluster="Admincafe"} -1.0
nutanix_cluster_total_untransformed_usage_bytes{cluster="Admincafe"} -1.0
nutanix_cluster_write_io_bandwidth_kbps{cluster="Admincafe"} 104.0
nutanix_cluster_write_io_ppm{cluster="Admincafe"} 695081.0
nutanix_host_avg_io_latency_usecs{hostname="NTNX-739347ed-A"} 309.0
nutanix_host_avg_io_latency_usecs{hostname="NTNX-d5104c7d-A"} 153.0
nutanix_host_avg_io_latency_usecs{hostname="NTNX-ee409937-A"} 206.0


Hi,

I am facing one issue after authenticating to nutanix. Its showing “401 Unauthorized”

I passed the url, username and password. It worked fine couple of hours and then it started showing 401 Unauthorized

Can you please help