Many of you already know X-ray as a valuable tool for measuring performance and resiliency on Nutanix. It’s always been built from the ground up with hyper-converged and cloud based platforms in mind and focuses on real world scenarios that you might encounter. For more background on why testing hyperconverged platforms with X-ray will give you the results that really matter see this excellent blog.
This post was updated May 16, 2022
X-ray 3.6 (coincidentally this was released alongside Files 3.6) introduced the capability to run I/O tests against an NFS file share. You can use this for stress-testing and sizing your Nutanix Files deployments. The Nutanix philosophy regarding X-ray has always been transparency above all else. In keeping with that tradition, X-ray doesn’t create the Fileserver or shares itself. We also leave the choice of fileserver configuration up to the user. The only new information that you need in order to run a test is the NFS fileserver hostname or IP and the share name. This means that it can easily test against a non-Nutanix Files NFS fileserver and share too.
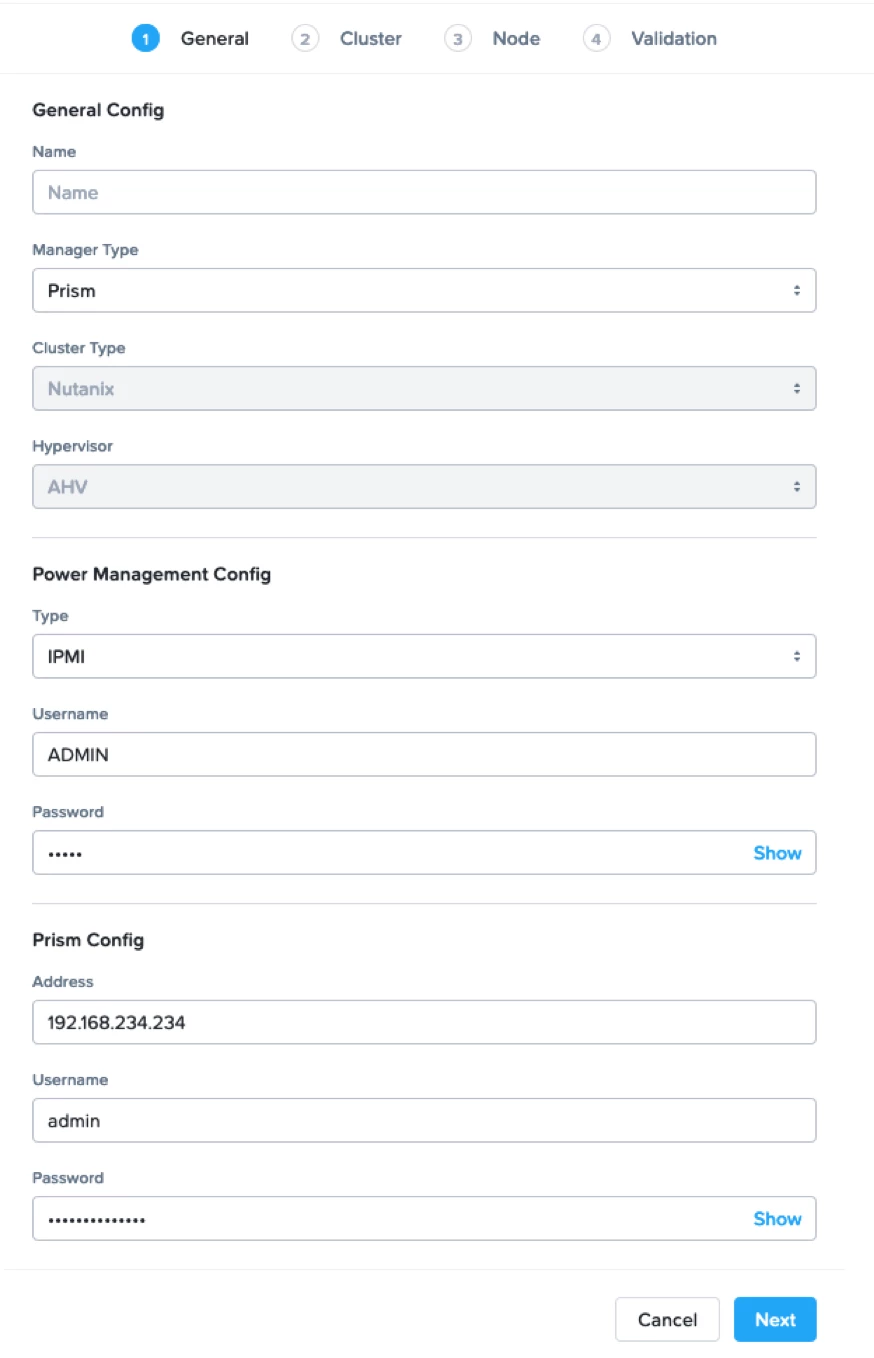
The procedure for configuring the system to test post-xray deployment is the same. Your first step will still be creating a target cluster. This will be where your NFS client VMs (your workload generators) will live. Note that there has to be enough CPU, RAM, storage and network addresses available on that cluster to support the number of clients that you request.

You supply the manager type (Prism for AHV, vCenter or SCVMM for other hypervisors.) and manager address and login.

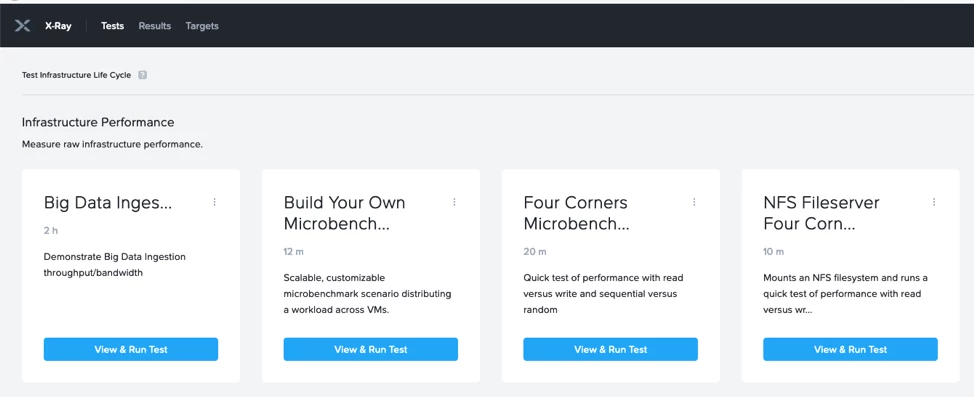
Now you are ready to run your I/O test. Click on the “NFS Fileserver Four Corners” test.

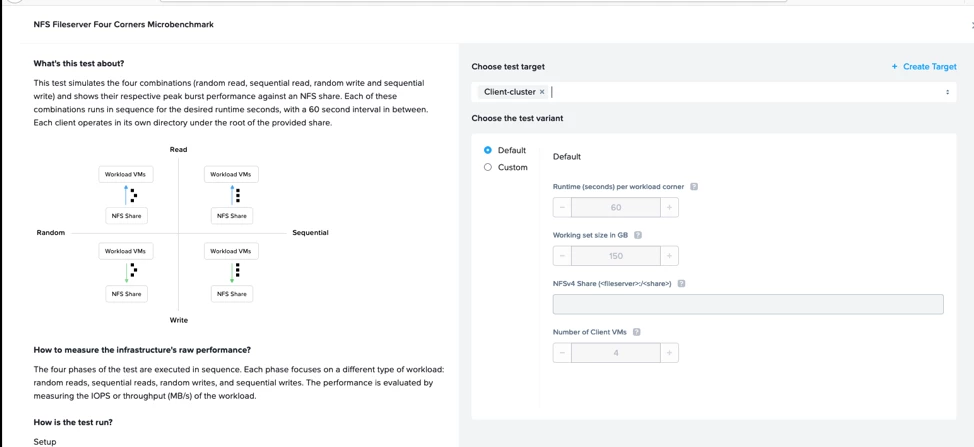
Choose your test target and then you can choose your performance test parameters. If you leave things set to default you will run a test that is 60 seconds per workload corner, 150GB of data working set size and 4 NFS client VMs.

Click the “Run test” button and away it goes. The workload included will pre-fill the share with the selected amount of data and then run a basic “four corners” performance test. With this you can get an understanding of the capability of the system for handling large block sequential and small block random workloads.
Once the test starts you can monitor the progress from the “Results” page.

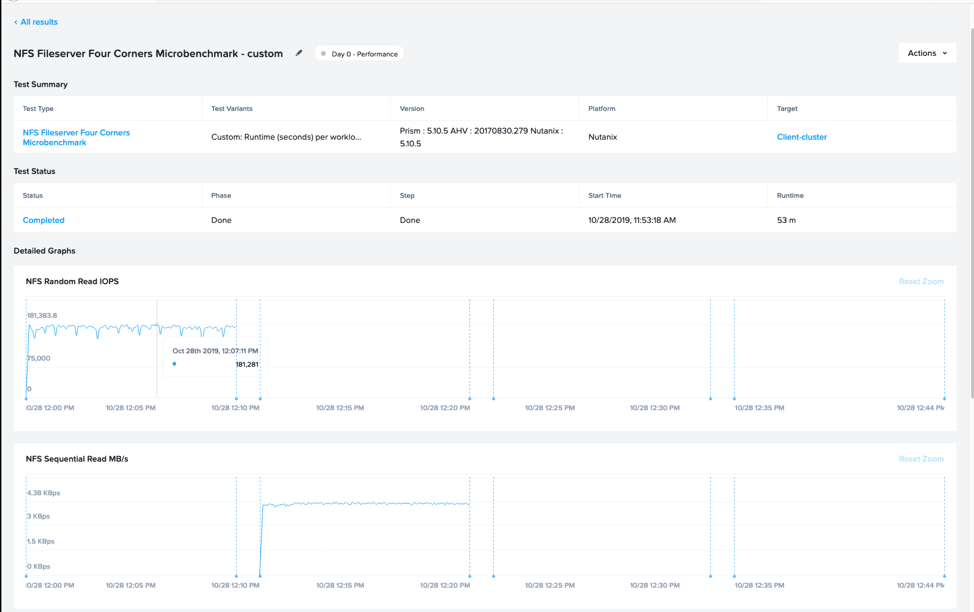
Once the tests complete you can see performance graphs for each workload.

You can rename your test results, create comparisons between two test results and also export your results into a pdf report. You can compare different Fileservers or different Files releases and configurations. Use this to POC your workload and ensure that your deployment is sized exactly as you need it to be.
In X-ray 4.1 we introduced the capability to track I/O latency along with throughput for Nutanix Files NFS tests. These latency metrics are gathered from the client NFS stack. Knowing client latency is especially useful when running random I/O tests since latency is a key indicator of performance for many applications that perform random I/O.

This post was authored by Will Strickland, Senior Core Performance Engineer Nutanix
©️️ 2019 Nutanix, Inc. All rights reserved. Nutanix, the Nutanix logo and the other Nutanix products and features mentioned herein are registered trademarks or trademarks of Nutanix, Inc. in the United States and other countries. All other brand names mentioned herein are for identification purposes only and may be the trademarks of their respective holder(s).


