

A new set of storage management innovations give HCI administrators even greater insight and control over how their data is being stored and protected
Nutanix’s HCI platform simplifies and streamlines IT infrastructure with an advanced distributed systems architecture that automates much of the day-to-day administration required with traditional infrastructure. The foundation of HCI is a distributed storage system that automates data management to optimize for consistent high performance with unmatched resiliency.
These innovative storage capabilities significantly reduce the amount of manual intervention required from storage administrators, while providing insights into system status and behavior is important for ensuring optimal system behavior, for capacity planning, and for heading off potential issues before they become a problem for end users.
As more and more organizations depend on Nutanix HCI for storing and protecting data associated with their most critical business applications, Nutanix continues to innovate new ways for administrators to see what is happening under the hood. Let’s take a look at some of the most significant recent enhancements.
Updates to the Storage Summary Widget
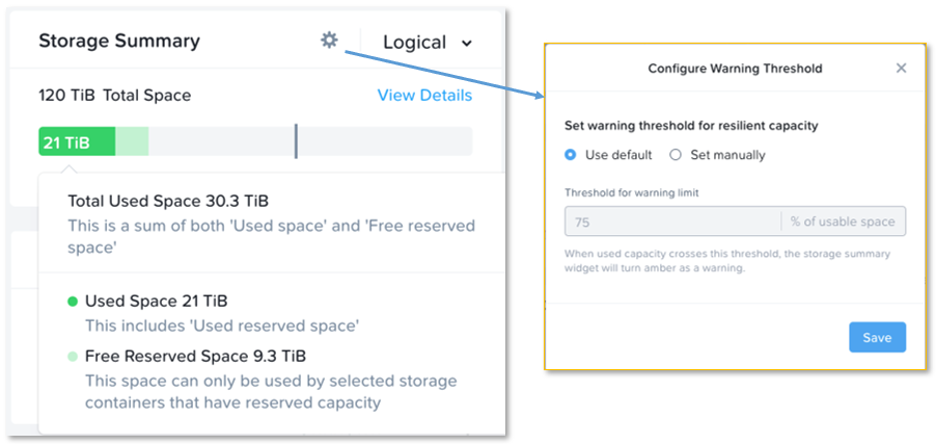
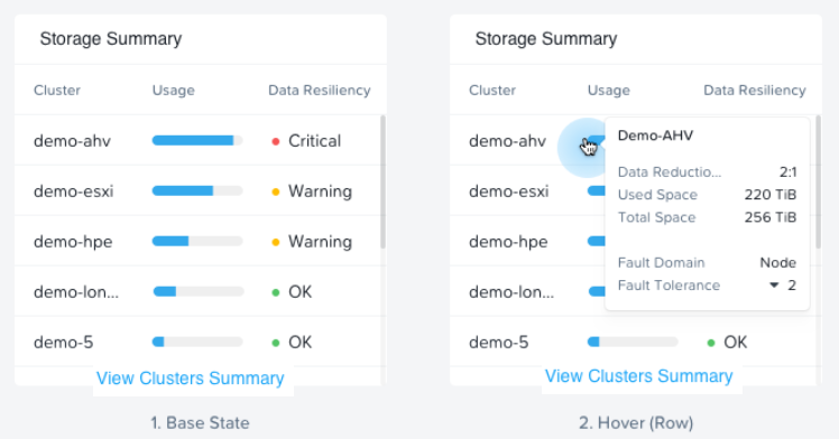
The storage summary widget in Figure 1 gives administrators an overview of storage utilization within a cluster, and it was recently enhanced to improve visibility into storage consumption. The new widget displays reserved capacity in addition to consumed and available capacity. It also adds a new configurable capacity alert threshold to help manage resilient capacity more effectively.
The storage capacity bar will turn orange when consumed capacity goes beyond the threshold, which is set to 75% of the resilient capacity by default. It will turn red when consumed capacity exceeds the resilient capacity of the cluster. In addition, a new detail view breaks down the capacity usage at a node level, which is particularly useful for clusters with mixed capacity and storage heavy nodes.
New Rebuild Progress Indicator in the Data Resiliency Widget
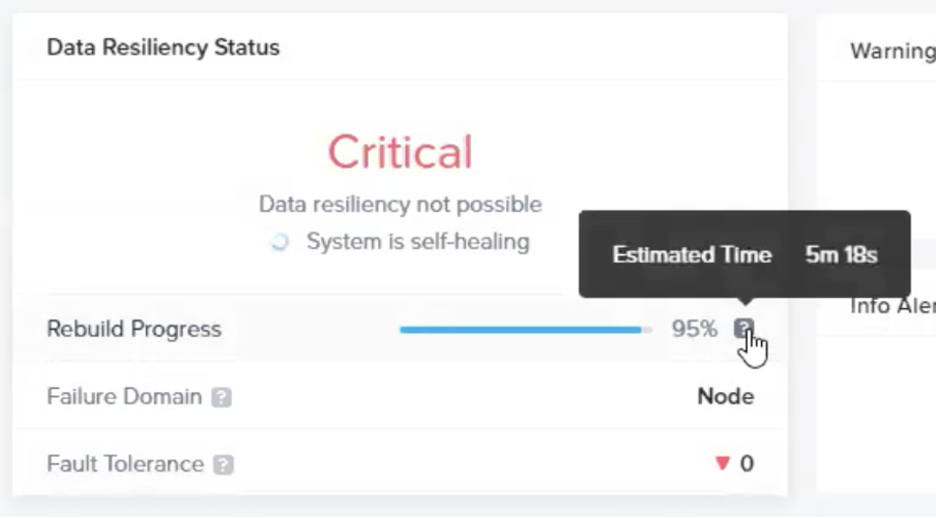
The storage resiliency widget has also been enhanced to bring greater insight to the current resiliency status of the cluster. The level of fault tolerance (FT 1 or FT 2) and the current fault domain (rack, block, or node) are now displayed. The widget now indicates if either has changed from its configured state. There is also a details page that provides fault tolerance information for each of the underlying components.
Perhaps most significantly, a new rebuild progress indicator has been added that enables administrators to track the time remaining until full resiliency has been restored to the cluster. The rebuild calculation uses distributed algorithms that take into account a large number of factors including the capacity to be rebuilt, the number and speed of individual drives, the number of nodes participating in the rebuild operation, and even the current I/O load on the cluster.
The “Reserve Rebuild Capacity” Setting
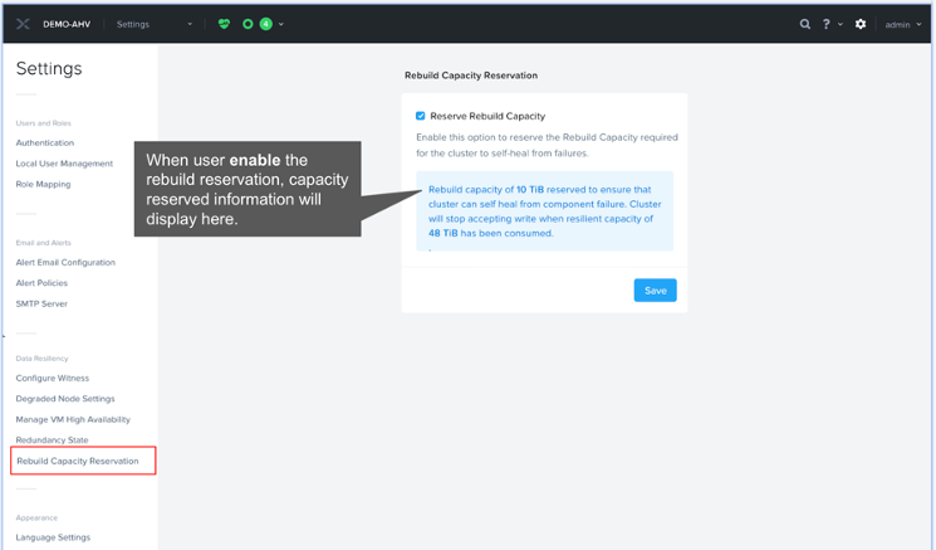
The Storage Summary and Resiliency widgets simplify capacity monitoring and visibility. Now there is a “Reserve Rebuild Capacity” setting that can be configured on a cluster to guarantee that there is sufficient capacity to rebuild in the event of a node failure. When configured, the cluster reserves the capacity of the largest node within the cluster, such that if a node fails there will be room to rebuild and go back to full resiliency.
This setting is particularly useful for environments with highly mission-critical data, but it can be left disabled for environments where manual intervention would be preferred to strictly enforcing the rebuild capacity.
The Overprovisioning Widget
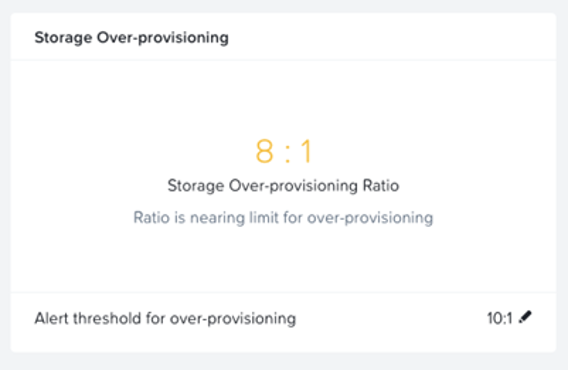
Nutanix AOS software thin provisions storage resources, and storage capacity is consumed only when data has actually been written to storage. This means that it’s possible to allocate more storage than is physically available in the cluster. There are many situations where this is desirable, but it’s important to monitor in order to prevent the cluster from unexpectedly running out of storage capacity.
The Storage overprovisioning widget shows how much storage is provisioned compared to how much is available, and a ratio limit can be configured to alert the administrator when the ratio has grown dangerously large. If the ratio reaches 70% of the configured limit, the widget display changes to amber, and it changes to red if the ratio exceeds 90%.
The Storage Container Breakdown View
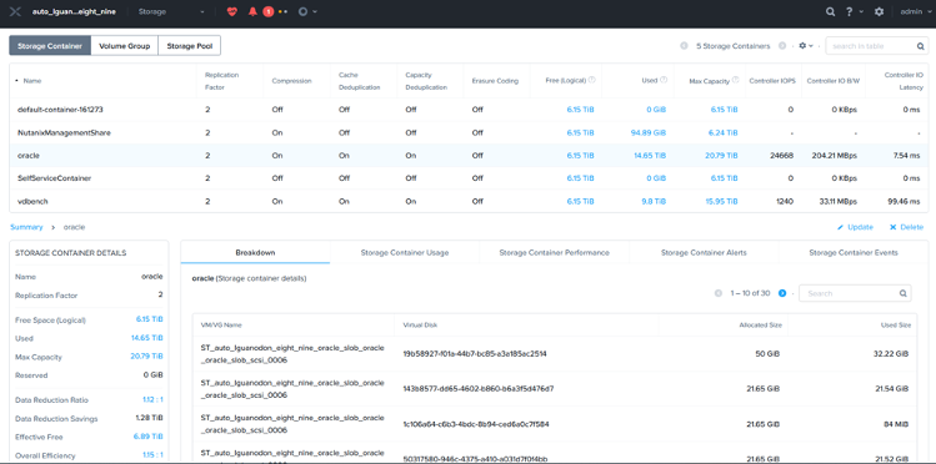
Nutanix HCI clusters carve out storage capacity into Storage Containers, which is where storage policies such as replication factor, compression, and deduplication are applied. Storage for VMs or Volume Groups (VGs) is then provisioned from within a Storage Container. The Storage Container breakdown view in Prism provides information about what is stored within the container, and it includes a full list of VMs and VGs in the Container.
Administrators can sort the Storage Container table view by various attributes, which makes it easy to quickly determine for example which VMs have the highest reserved capacity to find areas to quickly reclaim space.
The Multi-Cluster Resiliency Widget
Nutanix customers manage their global HCI environment with the Prism Central™ management console, which provides a single interface for managing multiple geographically distributed HCI clusters. The Multi-Cluster Resiliency Widget in Prism Central combines the functionality of the Storage Summary and Resiliency widgets into a single multi-cluster dashboard that makes it easy to monitor the capacity utilization and resiliency of all clusters from a single place.
This makes it easy for administrators to view the capacity and resiliency metrics for their distributed HCI deployment and take appropriate action. The metrics views are redesigned aesthetically to help consume the information easily and more meaningfully.
This post was authored by Aravindan Gopalakrishnan, Bibhash Seth and Steve Carter, Nutanix
© 2021 Nutanix, Inc. All rights reserved. Nutanix, the Nutanix logo and all Nutanix product, feature and service names mentioned herein are registered trademarks or trademarks of Nutanix, Inc. in the United States and other countries. Other brand names mentioned herein are for identification purposes only and may be the trademarks of their respective holder(s). This post may contain links to external websites that are not part of Nutanix.com. Nutanix does not control these sites and disclaims all responsibility for the content or accuracy of any external site. Our decision to link to an external site should not be considered an endorsement of any content on such a site. This post may contain express and implied forward-looking statements, which are not historical facts and are instead based on our current expectations, estimates and beliefs. The accuracy of such statements involves risks and uncertainties and depends upon future events, including those that may be beyond our control, and actual results may differ materially and adversely from those anticipated or implied by such statements. Any forward-looking statements included herein speak only as of the date hereof and, except as required by law, we assume no obligation to update or otherwise revise any of such forward-looking statements to reflect subsequent events or circumstances.