Gone are the days when CIOs and IT leaders were happy if their IT infrastructure just worked as advertised. In today’s hybrid IT world, the workloads have become operationally distributed across on-prem, managed services, multiple public clouds, and edge sites. Hybrid IT inherently brings in additional complexity to deploy and manage. Disaster recovery planning becomes quintessential for the smooth operations of hybrid IT when faced with natural or man-made disasters.
In the disaster recovery (DR) space, supporting options for different Recovery Point Objective (RPO: maximum amount of data a customer is willing to lose), Recovery Time Objective (RTO: acceptable time to restore operations when IT failure occurs) aligning to business needs is critical. And providing flexible options for protection workflows, DR failover runbooks, multi-site deployments, IP alignment post-recovery, etc., have all become table-stakes.
Today’s CIOs and IT leaders expect their DR environments to be smarter and efficient; auto-protect new VMs, prioritize a VM replication, provide meaningful and actionable recommendations on improving the RPO and RTO for applications and workloads, etc. In short, customers are looking to simplify their DR operations. Ultimately it boils down to meeting and/or exceeding the SLAs (RPO, RTO) and regulatory compliance all within a budget.
Nutanix has recognized these challenges and has been actively simplifying DR workflows:
- No data loss of critical applications with 0-second RPO and AHV sync replication
- Auto-protection of a new VM when added to a category
- Management of all DR operations across sites through a single Prism Central™ console
- 1 click for any type of recovery operation using the Nutanix Leap™ DR runbooks
- Support for in-guest script execution
- Static VM IP mapping
- File-level restore and more
These features have helped our customers easily navigate through DR operational complexities. With the AOS 6.0 and Prism Central (PC) 2021.5 releases, we are now adding visibility to DR operations as the first step towards DR analytics.
The new DR Monitoring and Reporting includes topology summary, replication summary and metrics, RPO violation (detailed and summary view), runbook tests summary, configuration health / alerts, snapshot change rates, and reports.
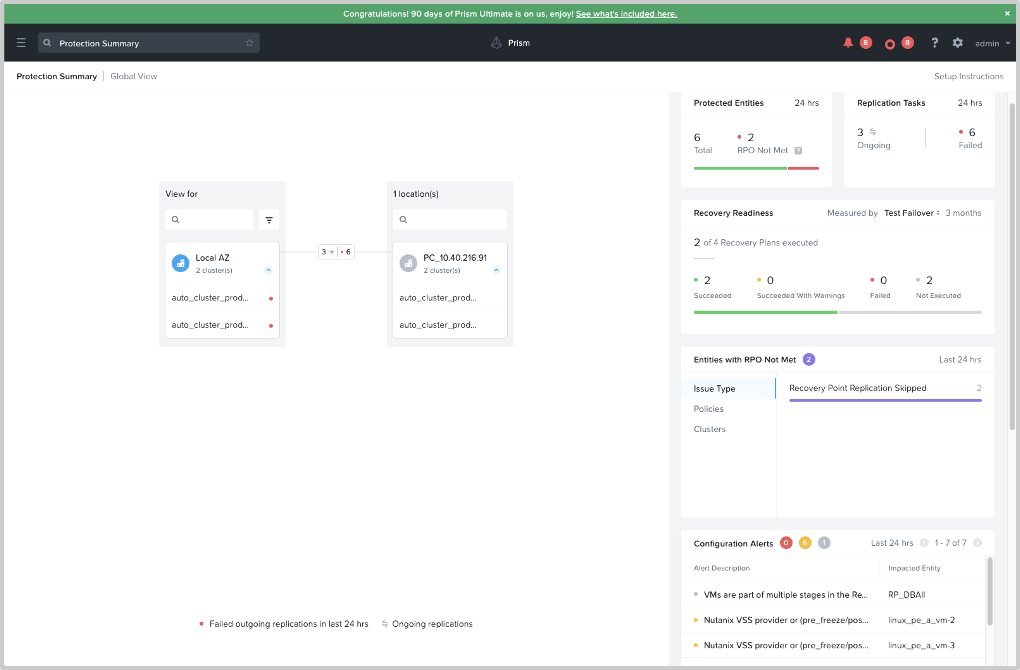
The global protection summary provides the DR topology view across different availability zones (sites) and clusters. The data to the right of the screen follows the selected topology view. The red dots besides the clusters indicates a DR-related issue with that cluster. Ongoing and failed replications are displayed between clusters. Detailed information about most of the items can be obtained by selecting the item in consideration. Each of the details are captured in pre-configured widgets.
Let’s look at each of the widgets in more detail.
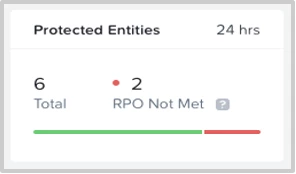
Protected Entities: Shows the number of entities that are currently protected and if one or more of them did not meet the set RPO over a time period. Clicking on the number above “RPO Not Met” gives you a filtered list of VMs not meeting the RPO. The information is captured across all the set protection rules.
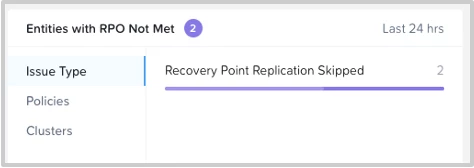
Entities with RPO Not Met: As the name specifies, this widget captures the reasons for RPO Not Met and the corresponding association to the protection policy and cluster. Detailed information is available on selection of either the reason or policies or clusters.
Replication Tasks: Every protected entity has many replication schedules in a given period. This widget shows ongoing replications and the past failed ones. Stuck replication tasks are also visible. Users can use this to find the failure pattern and help determine the cause of errors.
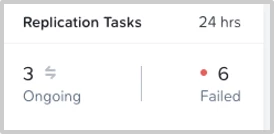
Note: A replication task could be stuck or failed due to a number of reasons such as lack of bandwidth, network errors, an unreachable destination cluster, a destination cluster with not enough resources, etc. As and when the cause is rectified, the entity being stuck moves to successful task completion or failure.
Recovery Readiness: This widget shows how many recovery plans have been validated, tested, or have done a failover (planned, unplanned, test) in the last 3 months. It also indicates how many have succeeded, succeeded with warnings, failed, or not executed.

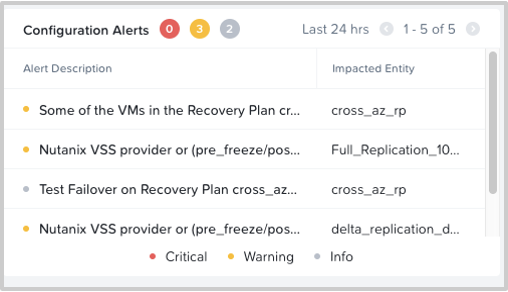
Configuration Alerts : The health of the DR system is important to keep the DR workflows running smoothly. Any protection rule misconfiguration, recovery plan misconfiguration or even abnormal working of DR service modules are captured in this widget. This would aid to identify any DR workflow issue. The alerts are classified into “Critical,” “Warning,” and “Info,” helping you to prioritize the tasks to be addressed.
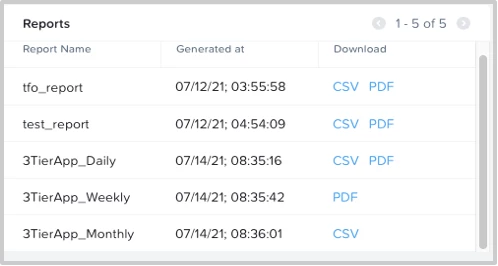
Reports: Generating reports is a key from an assurance and compliance perspective. Reports can be generated on daily, weekly, and monthly time intervals. This widget allows you to quickly view the generated reports. The reports can be generated in either .pdf or .csv format.
The report captures the details visible on the protection summary page: topology summary, summary of protected entities, and replication and recovery execution summary. It also provides a detailed list of replication and recovery events.
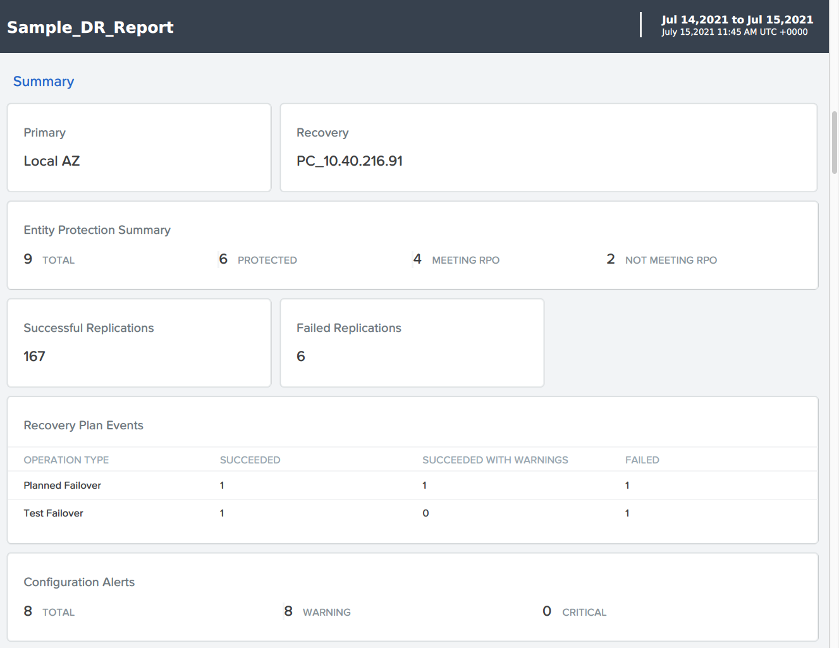
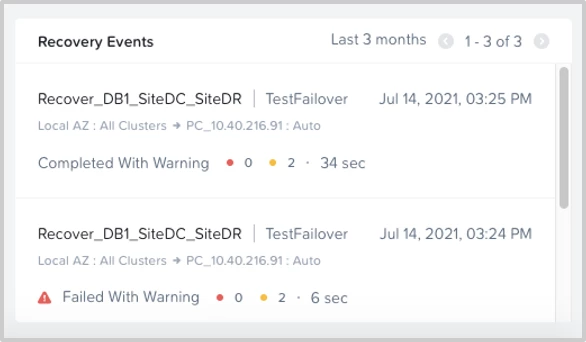
Recovery Events: This widget provides a summary of all the recovery events executed in a given time period. A link to the details of a specific individual taks is also provided for further investigation.
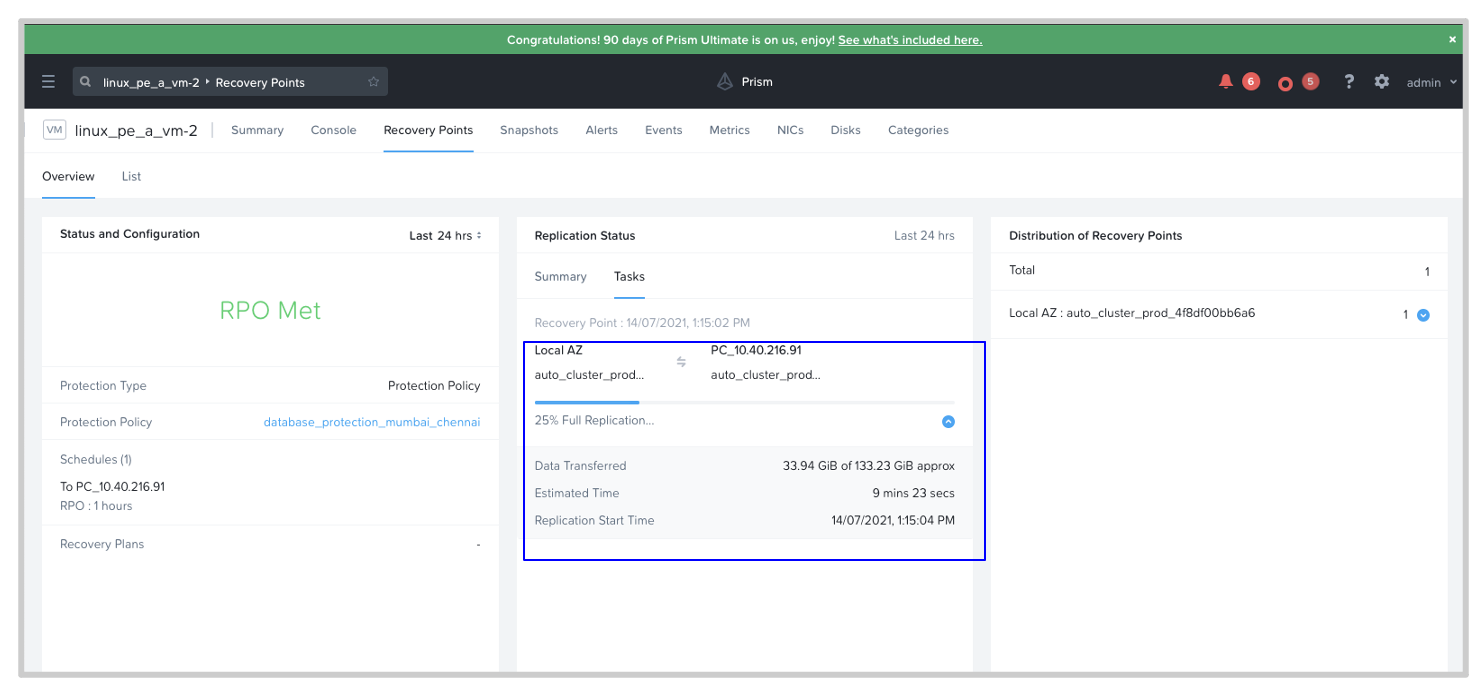
While we are on the topic of visibility, you can now see a detailed view of the transferred bytes during an on-going seeding replication and total expected completion time. The data points are available for every VM protected across one or more physical locations in a multi-site scenario.
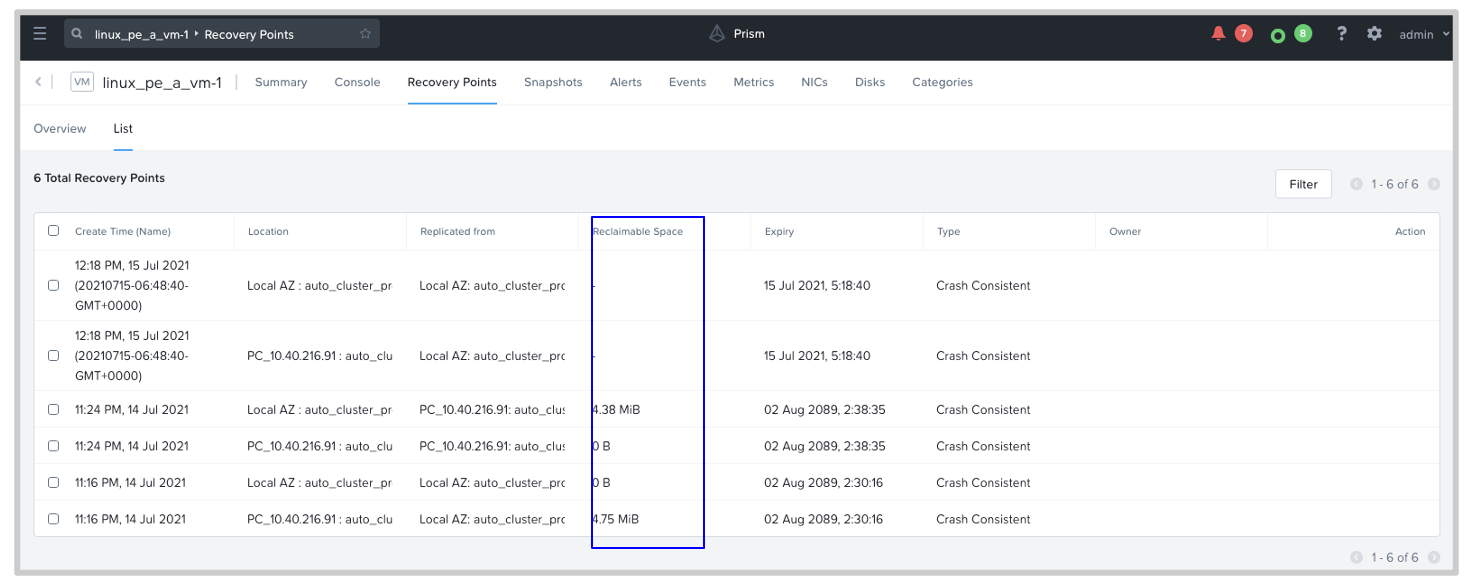
When the cluster capacity reaches a threshold level, alerts are displayed in the Prism Central console. It might be hard to do a real time assessment to determine whether one or more scheduled replication snapshots would fill the cluster capacity to the threshold set. Even post-assessment, freeing up cluster space could become an issue. With this release, Leap can capture the reclaimable space per recovery point. Using the provided details, you can make a choice to delete the recovery points that no longer serve your purpose.
Conclusion
Including DR planning in the initial hybrid IT deployment will help prevent later surprises. Having an intelligent DR system that can reduce the complex DR scenarios goes a long way in freeing time that could be used to focus on the actual business. Nutanix has been actively pursuing this path for DR with Leap DRaaS. The latest DR dashboard provides visibility and the foundation for DR analytics in the future.
This post was authored by Sujaikumar Jayarao, Nutanix
© 2021 Nutanix, Inc. All rights reserved. Nutanix, the Nutanix logo and all Nutanix product, feature and service names mentioned herein are registered trademarks or trademarks of Nutanix, Inc. in the United States and other countries. All other brand names mentioned herein are for identification purposes only and may be the trademarks of their respective holder(s). This post may contain links to external websites that are not part of Nutanix.com. Nutanix does not control these sites and disclaims all responsibility for the content or accuracy of any external site. Our decision to link to an external site should not be considered an endorsement of any content on such a site. Certain information contained in this post may relate to or be based on studies, publications, surveys and other data obtained from third-party sources and our own internal estimates and research. While we believe these third-party studies, publications, surveys and other data are reliable as of the date of this post, they have not independently verified, and we make no representation as to the adequacy, fairness, accuracy, or completeness of any information obtained from third-party sources.

