Page 1 / 1
You can create custom analysis chart in Analysis tab. So I suggest you to look there.
Hi
The Analysis dashboard allows you to create charts that can monitor dynamically a variety of performance measures. To view the Analysis dashboard, selectAnalysis from the pull-down list on the left of the main menu.
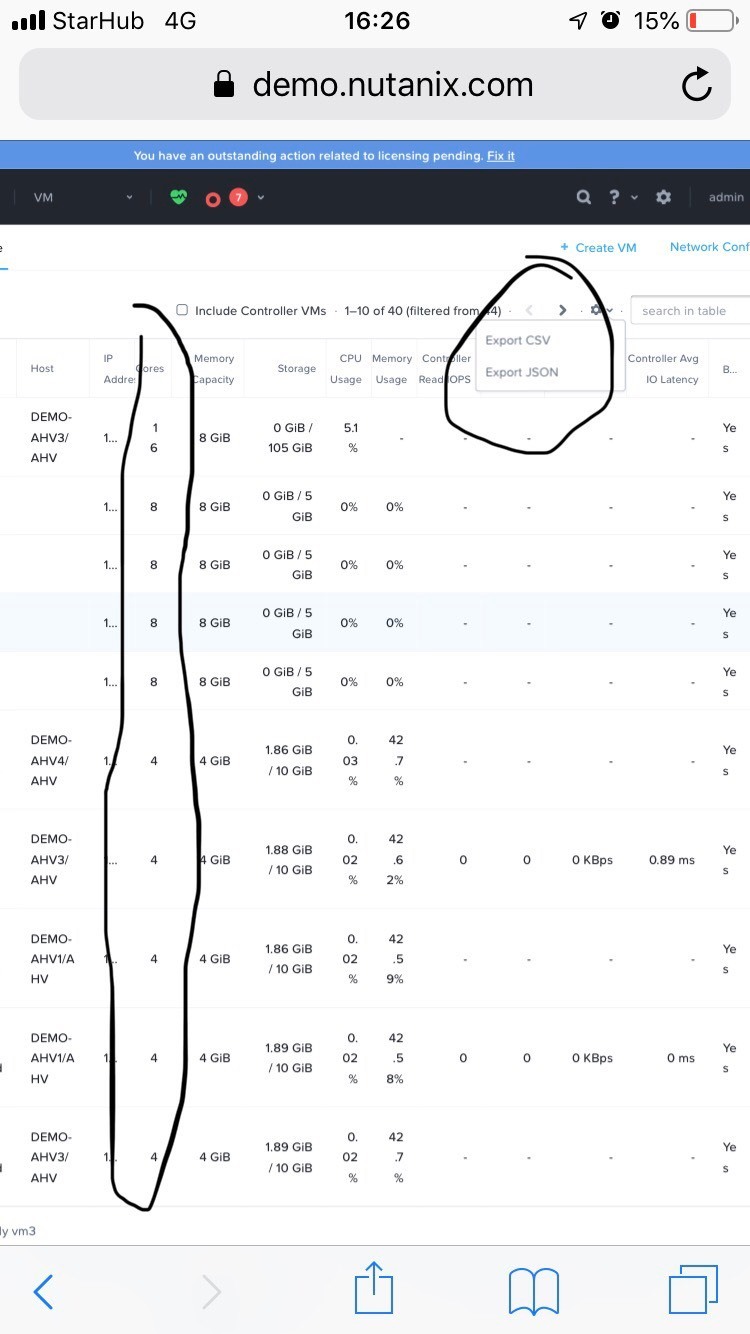
Performance data is stored for three months in the UI. You can export the performance data results in CSV or JSON format.
https://portal.nutanix.com/#/page/docs/details?targetId=Web-Console-Guide-Prism-v511:wc-performance-management-wc-c.html#topic_2d9_b19_0e
Hi
The Analysis dashboard allows you to create charts that can monitor dynamically a variety of performance measures. To view the Analysis dashboard, selectAnalysis from the pull-down list on the left of the main menu.
Performance data is stored for three months in the UI. You can export the performance data results in CSV or JSON format.
https://portal.nutanix.com/#/page/docs/details?targetId=Web-Console-Guide-Prism-v511:wc-performance-management-wc-c.html#topic_2d9_b19_0e
I would like to thank you for your help.
Can you mark this post as solved, so people looking with similar issues can find the solution faster? Thank you.
Enter your E-mail address. We'll send you an e-mail with instructions to reset your password.