Hello
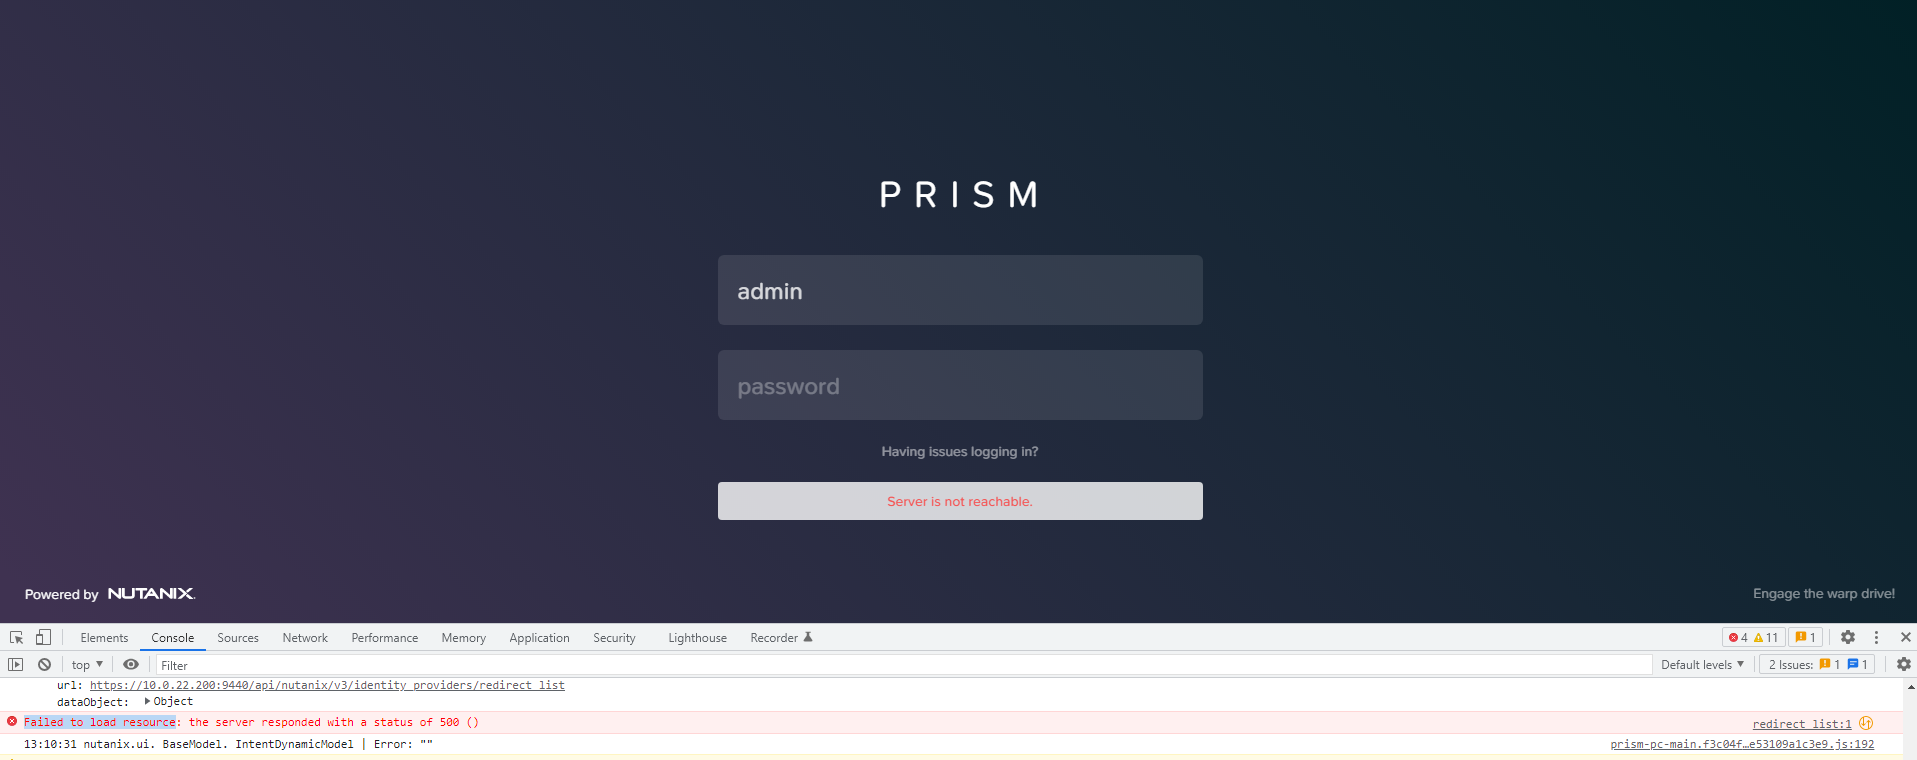
I’m trying to figure out why We are unable to login in to Prism central as below message appear when trying to login:

as it show in the dev tools ( Failed to load resource )
I have checked the apache and its not working but not sure if the issue has anything to do with httpd
below is the status of httpd on the PCVM
Redirecting to /bin/systemctl status httpd.service
● httpd.service
Loaded: masked (/dev/null; bad)
Active: inactive (dead)
nutanix@NTNX-1-A-PCVM:~$
nutanix@NTNX-A-PCVM:~$ sudo service httpd start
Redirecting to /bin/systemctl start httpd.service
Failed to start httpd.service: Unit is masked.
after that checked if a service does not start or there is any FATAL logs
for i in `svmips`; do echo "CVM: $i"; ssh $i "ls -ltr /home/nutanix/data/logs/*.FATAL"; done
/home/nutanix/data/logs/magneto.FATAL
/pollux.ntnx-10-0-22-199-a-pcvm.nutanix.log.FATAL.20220510-022710.119479
/home/nutanix/data/logs/lazan.FATAL
/home/nutanix/data/logs/uhura.FATAL
/home/nutanix/data/logs/catalog.FATAL
/home/nutanix/data/logs/atlas.FATAL
its look there is many services having problme
below is the output of lazan.FATAL:
2022-05-10 08:00:27,810Z ERROR 82014 /src/bigtop/infra/infra_server/cluster/service_monitor/service_monitor.c:106 StartServiceMonitor: Child 78634 exited with status:
1
2022-05-10 08:03:41,698Z ERROR 82014 /src/bigtop/infra/infra_server/cluster/service_monitor/service_monitor.c:106 StartServiceMonitor: Child 92258 exited with status: 1
2022-05-10 08:06:56,303Z ERROR 82014 /src/bigtop/infra/infra_server/cluster/service_monitor/service_monitor.c:106 StartServiceMonitor: Child 106030 exited with status: 1
2022-05-10 08:10:10,281Z ERROR 82014 /src/bigtop/infra/infra_server/cluster/service_monitor/service_monitor.c:106 StartServiceMonitor: Child 119408 exited with status: 1
2022-05-10 08:13:26,794Z ERROR 82014 /src/bigtop/infra/infra_server/cluster/service_monitor/service_monitor.c:106 StartServiceMonitor: Child 2255 exited with status: 1
I See the same ERROR on all FATAL files ( atlas.FATAL catalog.FATAL uhura.FATAL lazan.FATAL)
I Notes neuron_server restarting alot below is the output of the neuron_server.log file:
2022-05-10 08:53:08Z ERROR serviceability_executor.py:1599 Error while reading failed plugins file: /appliance/logical/serviceability/neuron_last_failed_plugins
2022-05-10 08:53:08Z INFO neuron_server.py:244 Start clean up of smart_alert_metadata entities from IDF
2022-05-10 08:53:08Z ERROR cleanup_entities.py:76 Exception occured during deletion of smart_alert_metadata entities: Failed to send RPC request.
2022-05-10 08:53:08Z INFO zookeeper_session.py:190 neuron_server.py is attempting to connect to Zookeeper
2022-05-10 08:53:08Z INFO zookeeper_session.py:629 ZK session establishment complete, sessionId=0x2804ef58f8de8a9, negotiated timeout=20 secs
2022-05-10 08:53:08Z CRITICAL decorators.py:47 Traceback (most recent call last):
File "build/bdist.linux-x86_64/egg/util/misc/decorators.py", line 41, in wrapper
File "/home/nutanix/neuron/bin/neuron_server.py", line 274, in run
xfit_config.initialize_pc_services()
File "/usr/local/nutanix/neuron/lib/py/nutanix_neuron.egg/neuron/utils/xfit_config.py", line 58, in initialize_pc_services
xfit_pc_type = self.__get_xfit_pc_type()
File "/usr/local/nutanix/neuron/lib/py/nutanix_neuron.egg/neuron/utils/xfit_config.py", line 110, in __get_xfit_pc_type
nucalm_status = prism_central_utils.get_nucalm_enablement_flag()
File "build/bdist.linux-x86_64/egg/util/prism_central/utils.py", line 1191, in get_nucalm_enablement_flag
ImportError: No module named proto.nucalm_enablement_pb2
its look like there is a python script not working ( decorators.py )
I’m not sure what is the root cause, can anyone help with this issues
thank you in advance


