Background: we received an alert from prism central that one of our cluster's was going to run out of CPU soon. I checked in the hypervisor (esxi) and in prism element and in central under analysis but i could not find an issue. Then, i checked planning and it shows us running out of CPU very soon.
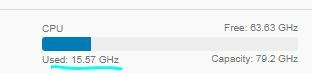
At first i thought the initial load up was skewing the data, but when i looked closer, i noticed that the value planning was using for our current usage was at 50Ghz, when the hypervisor is reporting 12Ghz (cluster of 3).I pulled all of the other cluster's planning data and all of them have the same problem, CPU usage is being greatly over reported on the planning chart.
Charts under analysis agree with the hypervisor, but these are looking at % usage, not hz.
What gives? is there a bug in how planning is calculating CPU usage? or perhaps my hypervisor is under reporting by a factor of 3? (seems unlikely)looky: