Hello dear Nutanix community,
Just wanted to check, does the IPMI port on NX servers offer a UI for server health monitoring/management and temperature/fan stats like iDRAC for Dell XC servers or HP iLO for HP?
Thank you.
Hello dear Nutanix community,
Just wanted to check, does the IPMI port on NX servers offer a UI for server health monitoring/management and temperature/fan stats like iDRAC for Dell XC servers or HP iLO for HP?
Thank you.
Best answer by bcaballero
Hi
Yes the do! I’m not used to Dell iDRACs but let me show a few snapshots from an NX block on my lab It’s a little bit old, but you can get the idea.
Temperature Sensors:

Event Log:

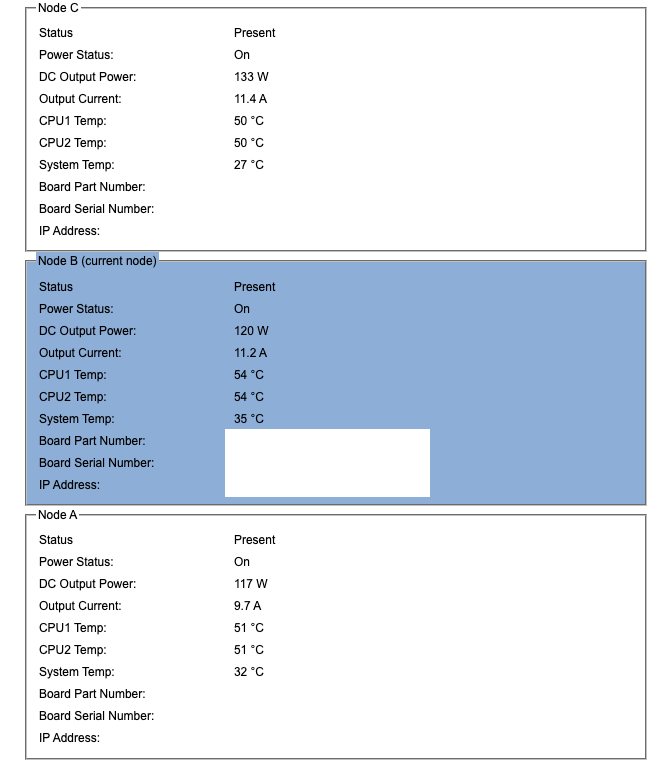
Multi Node Stats from a 4-Node block (Sorry Node-D didn’t fit into the snapshot)

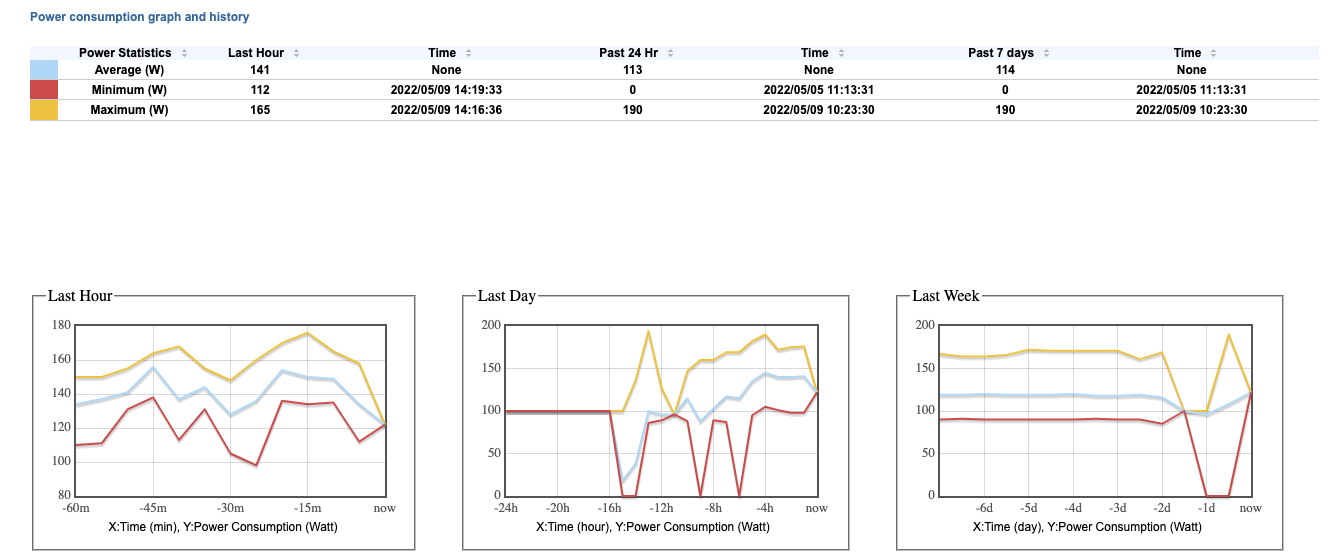
Also Power Consumption (Good to know)

Hope this helps!
Regards!
Enter your E-mail address. We'll send you an e-mail with instructions to reset your password.