Question

How do I remove this critical alert?

  • 2 September 2020
  • 6 replies
  • 1505 views

Badge +1

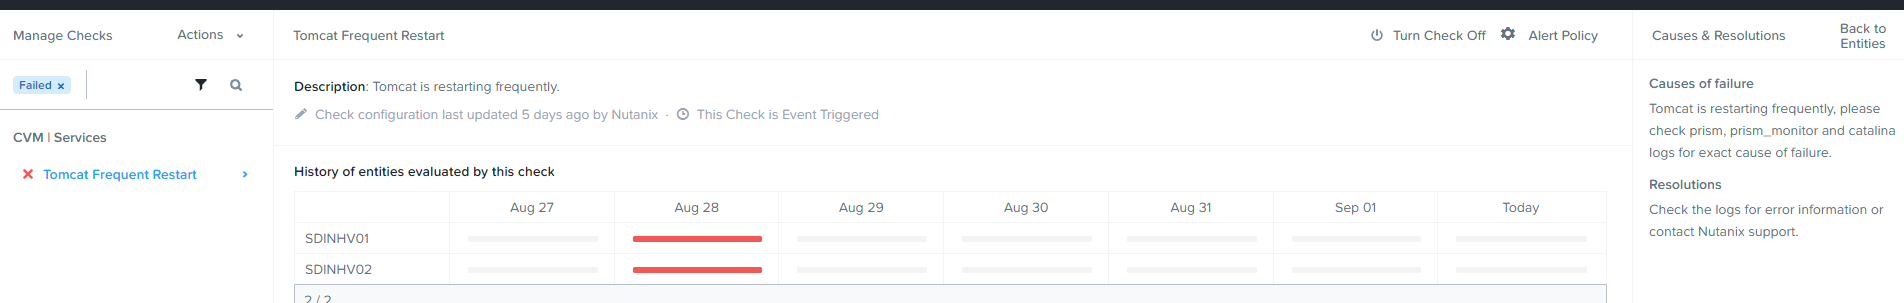
I don’t see anywhere to acknowledge or remove this alert, it is no longer an issue and we resolved what was causing the issue but it keeps showing that we have a critical alert for the 28th.


This topic has been closed for comments

6 replies

Userlevel 3
Badge +4

Hi @Chadd 

Under certain conditions, tomcat may fail heartbeats and once this happens 3 consecutive times, the service will restart. If the service restarts 8 times in 4 hours, this alert is raised.


You can refer below KB article

https://portal.nutanix.com/kb/000008524


May I know the current NCC and AOS version?

Badge +1

Hi @Chadd 

Under certain conditions, tomcat may fail heartbeats and once this happens 3 consecutive times, the service will restart. If the service restarts 8 times in 4 hours, this alert is raised.


You can refer below KB article

https://portal.nutanix.com/kb/000008524


May I know the current NCC and AOS version?

NCC Version: 3.10.0.1

AOS 5.15.1.1


The error only occured on the 28th and we’ve resolved the cause of it, however I do not know how to clear the critical error message

Userlevel 6
Badge +5

Hi Chadd,

The screenshot you’re sharing is from Health page which displays the history of the cluster health as well as current issues.

As you stated, the error took place and was resolved and so it will remain in the history of the health checks.

Unless you see the same error in the Alerts section you can safely ignore this part. The check is event-triggered meaning there will be either no logged check or an error.

I can understand how this can confuse things a little bit but also this section is aimed at providing a big picture of cluster health to determine any patterns simultaneous occurrences.

Userlevel 1
Badge +1

I have the same issue as you, When i checked the NCC logs, It doesnt show any error regarding on Tomcat, then Upon deep checking with nutanix support. The cluster is healthy.

What i did is Turn off the alert and turn it on again then the alert is gone.


Badge +1

Hi Chadd,

The screenshot you’re sharing is from Health page which displays the history of the cluster health as well as current issues.

As you stated, the error took place and was resolved and so it will remain in the history of the health checks.

Unless you see the same error in the Alerts section you can safely ignore this part. The check is event-triggered meaning there will be either no logged check or an error.

I can understand how this can confuse things a little bit but also this section is aimed at providing a big picture of cluster health to determine any patterns simultaneous occurrences.

It is also up top, will is stay there forever?

Userlevel 2
Badge +3

Restart the prism service on Prism leader which is generally on the Cluster VIP address or wait for few days. If the alert turned off, it should go away.