


The network panel in ESXTOP has a few metrics that will enable you to determine issues such as loss of network on a VM or high dropped packet on specific nics. Below is simple overview on how to use esxtop for networking:
How to access:
Log into your ESXi host and type esxtop
Press ‘n’ to show only the networking view
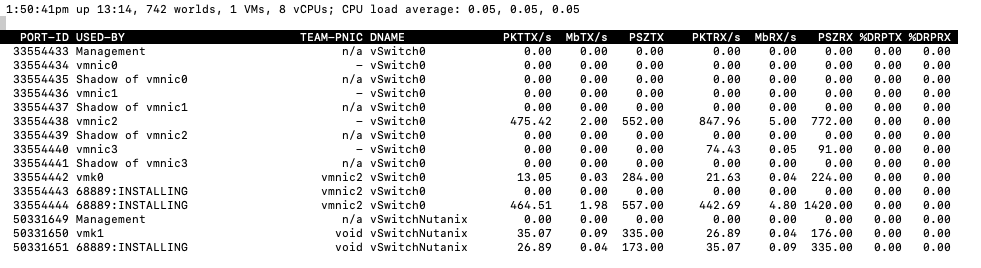
Port ID - The port ID used on the virtual switch. This ID is used for example for network traces with pktcap-uw.
Press 'N' to sort by PORT-ID column.
USED-BY - Indicates what is connected to the virtual switch port. Connected devices can be virtual machine NICs, VMkernel ports (vmk#), physical NICs (vmnic#) or ports used for health checks (Shadow of vmnic#).
TEAM-PNIC - The physical NIC that the corresponding device is actively using. This information is helpful for network troubleshooting.
%DRPTX - Dropped packets transmitted, hardware overworked. Possible cause : very high network utilization.
%DRPRX - Dropped packets received, hardware overworked. Possible cause : very high network utilization.
ESXTOP can provide live view of the physical network showing us the MbTX/s and MbRX/s (Amount of data transmitted or Received in Mbps) on each of the virtual switch of the ESXi host.
In problem-solving, recognizing the bottleneck or the Root case always becomes critical and hence the parameter of dropped packets becomes important.
Dropped packets can occur for a number of reasons. Possible causes include
-
high guest CPU utilization,
-
having incorrect network drivers installed in the guest OS.
-
insufficient uplink capacity in the vSwitch to cope with demand.
Some other metrics shown are
-
MbTX/s – Amount of data transmitted in Mbps
-
MbRX/s – Amount of data received in Mbps
-
PKTTX/s – Average number of packets transmitted per second in the sampling interval
-
PKTRX/s – Average number of packets received per second in the sampling interval
Some great resources for learning ESXTOP:
-
Gather esxtop using cronjob - https://kb.vmware.com/s/article/1033346