Hi
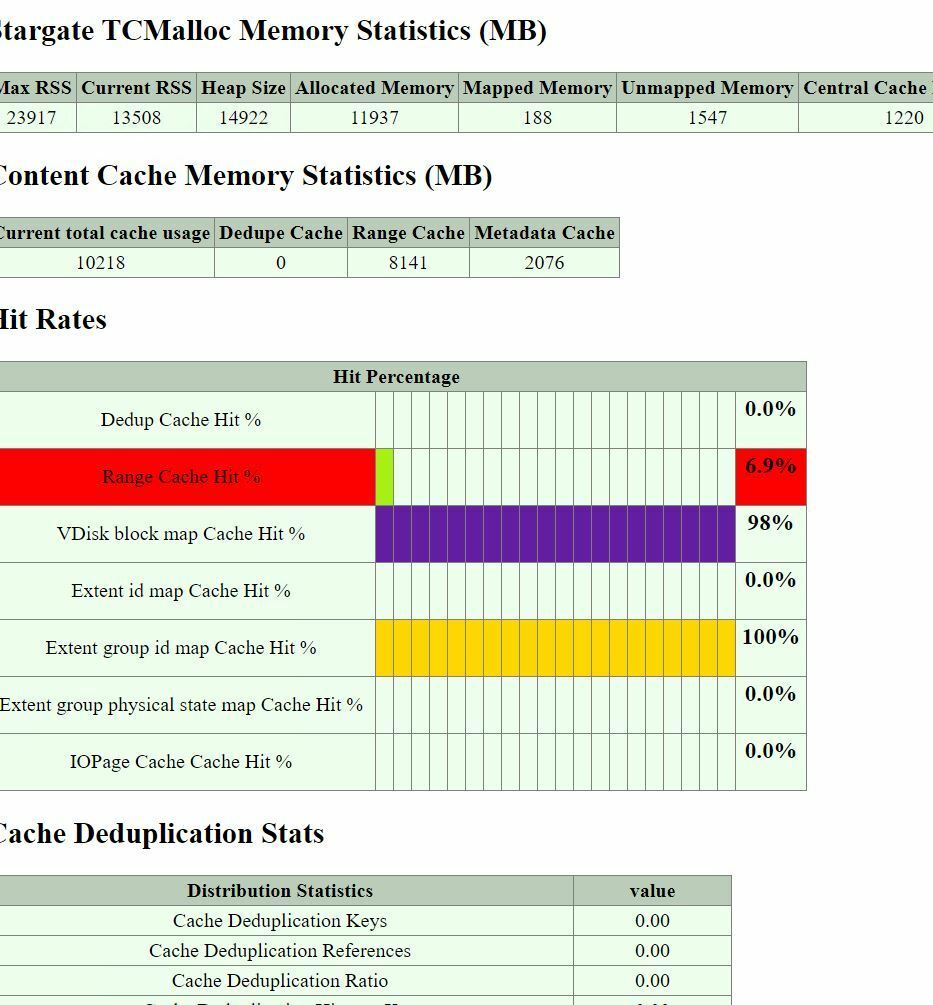
I am new in Nutanix , would you please explain for me the below stats , and what its performance in VMs performance , the cache stats screen i got it while the backup is running ?

Hi
I am new in Nutanix , would you please explain for me the below stats , and what its performance in VMs performance , the cache stats screen i got it while the backup is running ?

Best answer by sbarab
From the graphics you have in the above, I am guessing you mean “Range cache hit %” as oppose to “Content cache hit rate”. Correct me if I am wrong and I will try to explain about them here. Most people have a “low read” hit rate for range cache as the work load is not predictive enough. So a 5% to 6% value may not be a bad number here compare to a zero percent which indicates a total unpredictability.
But for other hit rates in cache_stats like “vdisk block map” and “extentgroupid” map we want to have high hit ratio say 90+% cause if we miss here it results in an on-disk look uo from cassandra (service that cans the cluster data), which is much slower. I don’t go any further than this in here but just wanted to show that there is a difference between each of the hit rates indicated in page 2009 under “cache_stats”
So I did some research and here is what I have found. The ”Content Cache Hit Rate (%) as presented in “Analysis” page in prism is really a combination of what “cache_stats” show in the page 2009 of the cluster. As it is now, it perhaps is not the best measure of assessing performance in cluster as each of the parameters show a specific information and adding them up may not translate well about cluster perfromance overall. That will be changed in the future so people can pick the exact parameter they want among the cache_stats.
Hope this shed some more light on your concern.
Enter your E-mail address. We'll send you an e-mail with instructions to reset your password.