

In the first 3 Sections we saw solutions with classical snmp monitoring, dynamic monitoring with checkmk and metrics with prometheus and grafana.
No we try the windows way. A Windows Application from the german vendor “Paessler” which could be tried for free for 100 sensors (not Nodes or VMs!).
We download the Package here and install.
After successfull Installation we get a Browser Page on Port :8080 and a LoginPrompt with default prtgadmin / prtgadmin.

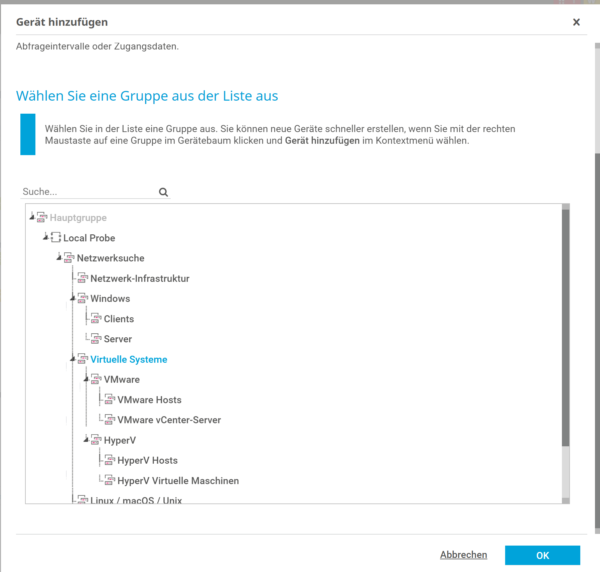
We login and create a new Host over the Menue Geräte/Geräte hinzufügen for our Nutanix Cluster:
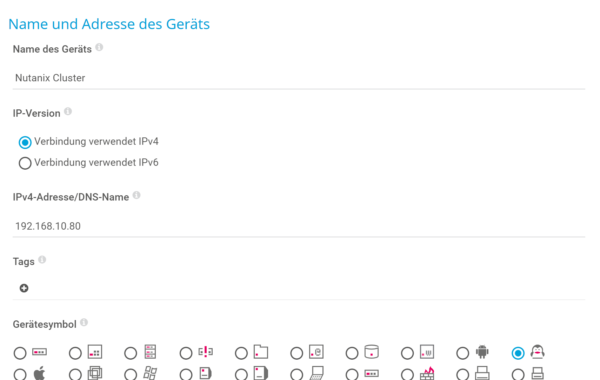
Type in Name and IP from our Cluster (Nutanix Cluster IP)
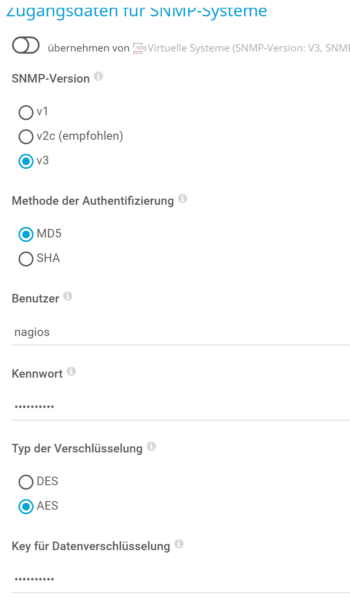
ATTENTION: Scroll DOWN and type in the Values from your SNMP Secrets!:
After Click on OK the Host is created and a basic check is made via PING.. The System tries an autodisovery now but this is not needed for a nutanix cluster here!
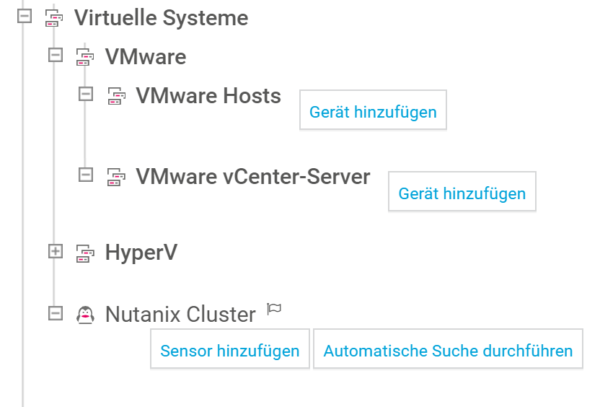
We klick on NOT “Automatic Discovery” (takes very long against a nutanix cluster!) and choose INSERT SENSOR (Sensor hinzufügen in Gernan)

We will find now 2 Checks for a Cluster and also for a Nutanix HOST/NODE!
ATTENTION: Actual Status is BETAcode. But it is working and we choose both for our 3 node Cluster.
If the Discovery is not working please control your snmp credentials and CHECK if you use SHA and NOT AES!
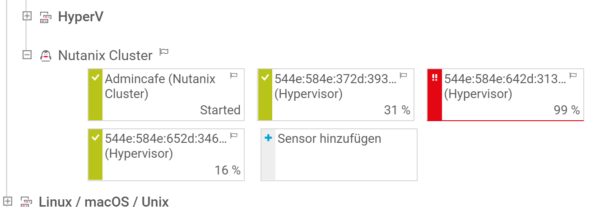
The Cluster will be created and we choose all 3 nodes for the host part too!
The Host will be present like this one:
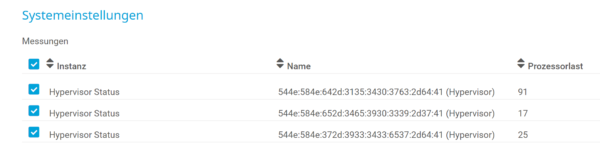
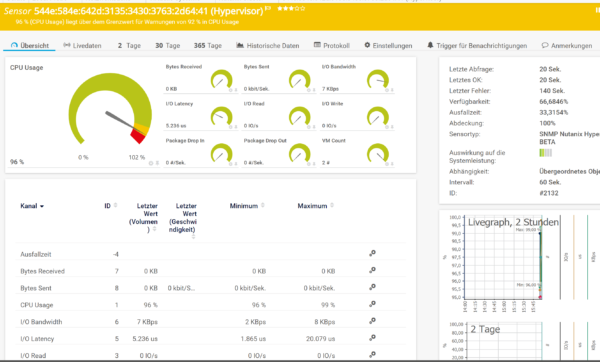
With a click on the Nutanix Cluster we get all Informations about the CLUSTER now:

Even with a click of one of the NODEs:
Just let the discovery do his job and we will get a nice monitoring solution on a windows os plattform!
In bigger Environments 100 Sensors are small and you will find more pricing informations here….
Have fun...