Solved

Chart from Prism with blank interval

  • 8 October 2015
  • 5 replies
  • 1245 views

Userlevel 1
Badge +10
Hi there,

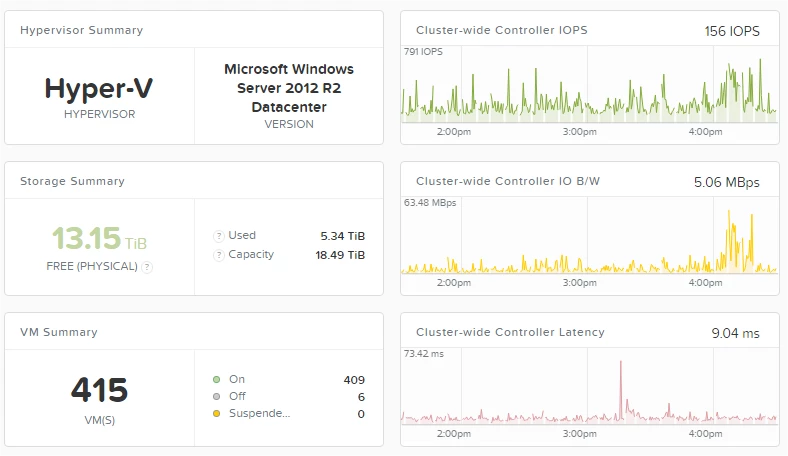
I'm facing a problem with Prism that display some weird chart.
As you can see above, the chart shows no value (blank) every 6mins.


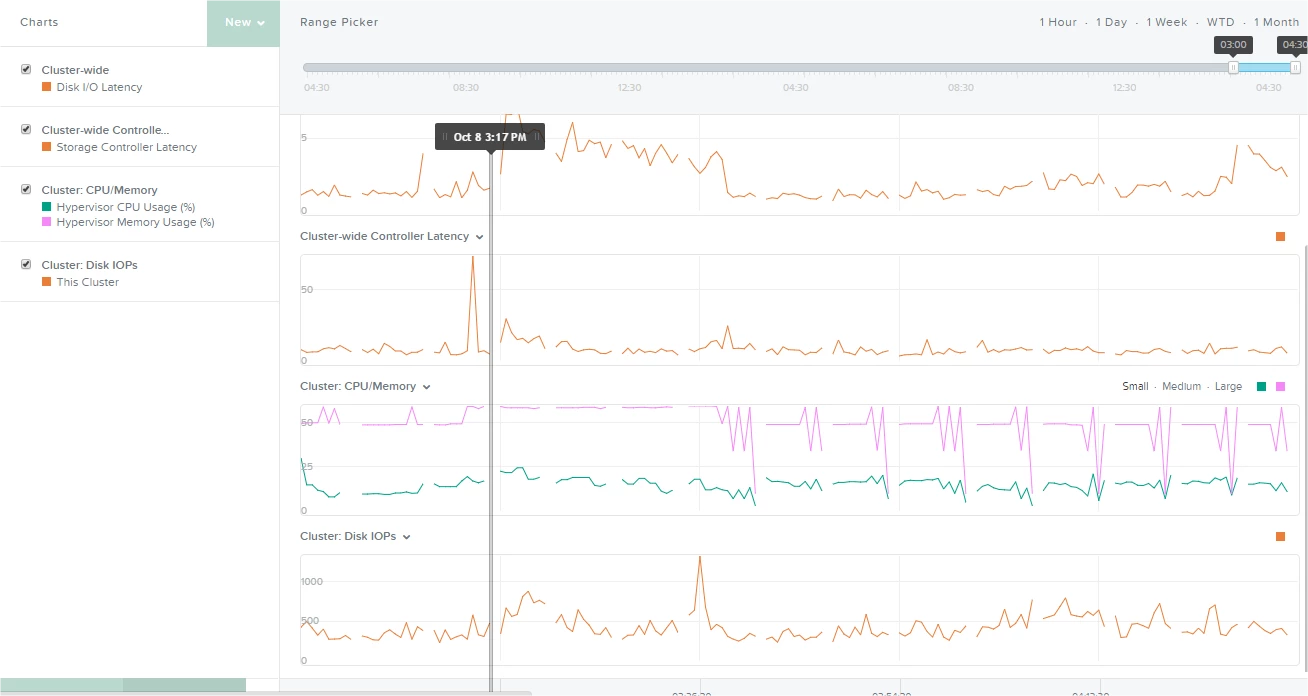
When I go to the analysis page, the blank is still present and there is some strange movement of the Memory line:


Do you know where this could come from ?
icon

Best answer by tduval 23 October 2015, 12:21

View original

This topic has been closed for comments

5 replies

Userlevel 1
Badge +10
The KB 1964 (https://portal.nutanix.com/#/page/kbs/details?targetId=kA0600000008hKrCAI) resolve the issue.
Userlevel 1
Badge +10
After reading from arithmos log, I cannot found any intel indicating a malfunction of this service.
There's a lot of line like this:
$ tail data/logs/arithmos.INFOI1009 10:55:20.523607 6801 arithmos_entity_type_data.cc:338] Timestamp has gone backward for stat controller_total_read_io_size_kbytes from 1444380914097769 to 1444380912095650 for entity D1A97E62-80D0-4EA7-B4E6-064F4C6A2E72I1009 10:55:20.523608 6801 arithmos_entity_type_data.cc:338] Timestamp has gone backward for stat controller_total_read_io_time_usecs from 1444380914097769 to 1444380912095650 for entity D1A97E62-80D0-4EA7-B4E6-064F4C6A2E72I1009 10:55:20.523610 6801 arithmos_entity_type_data.cc:338] Timestamp has gone backward for stat controller_total_io_time_usecs from 1444380914097769 to 1444380912095650 for entity D1A97E62-80D0-4EA7-B4E6-064F4C6A2E72I1009 10:55:20.523613 6801 arithmos_entity_type_data.cc:338] Timestamp has gone backward for stat controller_timespan_usecs from 1444380914097769 to 1444380912095650 for entity D1A97E62-80D0-4EA7-B4E6-064F4C6A2E72I1009 10:55:20.523615 6801 arithmos_entity_type_data.cc:338] Timestamp has gone backward for stat controller_total_io_size_kbytes from 1444380914097769 to 1444380912095650 for entity D1A97E62-80D0-4EA7-B4E6-064F4C6A2E72I1009 10:55:20.523617 6801 arithmos_entity_type_data.cc:338] Timestamp has gone backward for stat controller_total_transformed_usage_bytes from 1444380914097769 to 1444380912095650 for entity D1A97E62-80D0-4EA7-B4E6-064F4C6A2E72I1009 10:55:20.523619 6801 arithmos_entity_type_data.cc:338] Timestamp has gone backward for stat controller_user_bytes from 1444380914097769 to 1444380912095650 for entity D1A97E62-80D0-4EA7-B4E6-064F4C6A2E72I1009 10:55:20.523627 6801 arithmos_entity_type_data.cc:338] Timestamp has gone backward for stat controller_num_read_io from 1444380914097769 to 1444380912095650 for entity DBFBB6AC-4ACB-4F4B-A8FC-06A80C640C79I1009 10:55:20.523629 6801 arithmos_entity_type_data.cc:338] Timestamp has gone backward for stat controller_num_io from 1444380914097769 to 1444380912095650 for entity DBFBB6AC-4ACB-4F4B-A8FC-06A80C640C79
Userlevel 4
Badge +18
Hyperint service is responsible for getting stats from hypervisor which are then polled by arithmos service. Artihmos service publishes all stats to prism.

So most likely it will be arithmos but we would need to take a look at the logs to confirm our diagnosis.

-NP
Userlevel 1
Badge +10
Do you know the services name that could be responsible of this ? I'm thinking of hyperint but not sure.
Userlevel 4
Badge +18
Hi 

By the looks of it, it seems like a service responsible for polling stats crashing/restarting at a fixed interval but it might need further debugging to further understand this issue.

I would request you to open up a support request with Nutanix Global support team.

NP