Monitor Your Apps with Epoch

  • 15 November 2018
  • 6 replies
  • 1551 views

Userlevel 4
Badge +19
Xi Epoch generates live application maps to provide instantaneous visibility into your application health without any code instrumentation. Epoch provides visibility into the interactions between components in distributed architectures, without dependency on specific language or framework implementation. As a result, operations team can quickly ensure reliability and availability of any application in any cloud environment.

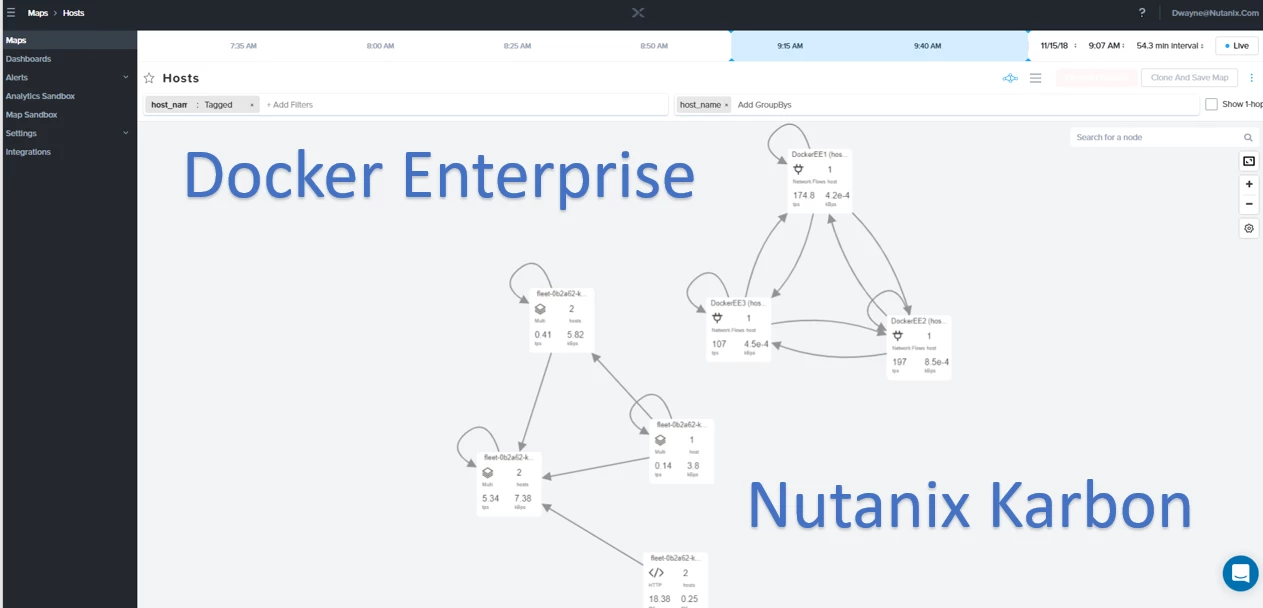
The picture below is showing two different Kubernetes Clusters, Docker Enterprise and Nutanix Karbon. The collectors are deployed as daemon sets so they can be deployed to any Kubernetes cluster to start monitoring your applications. Epoch collectors can be run in both containerized as well as non-containerized environments. Only one collector is needed per host (VM or bare metal OS).


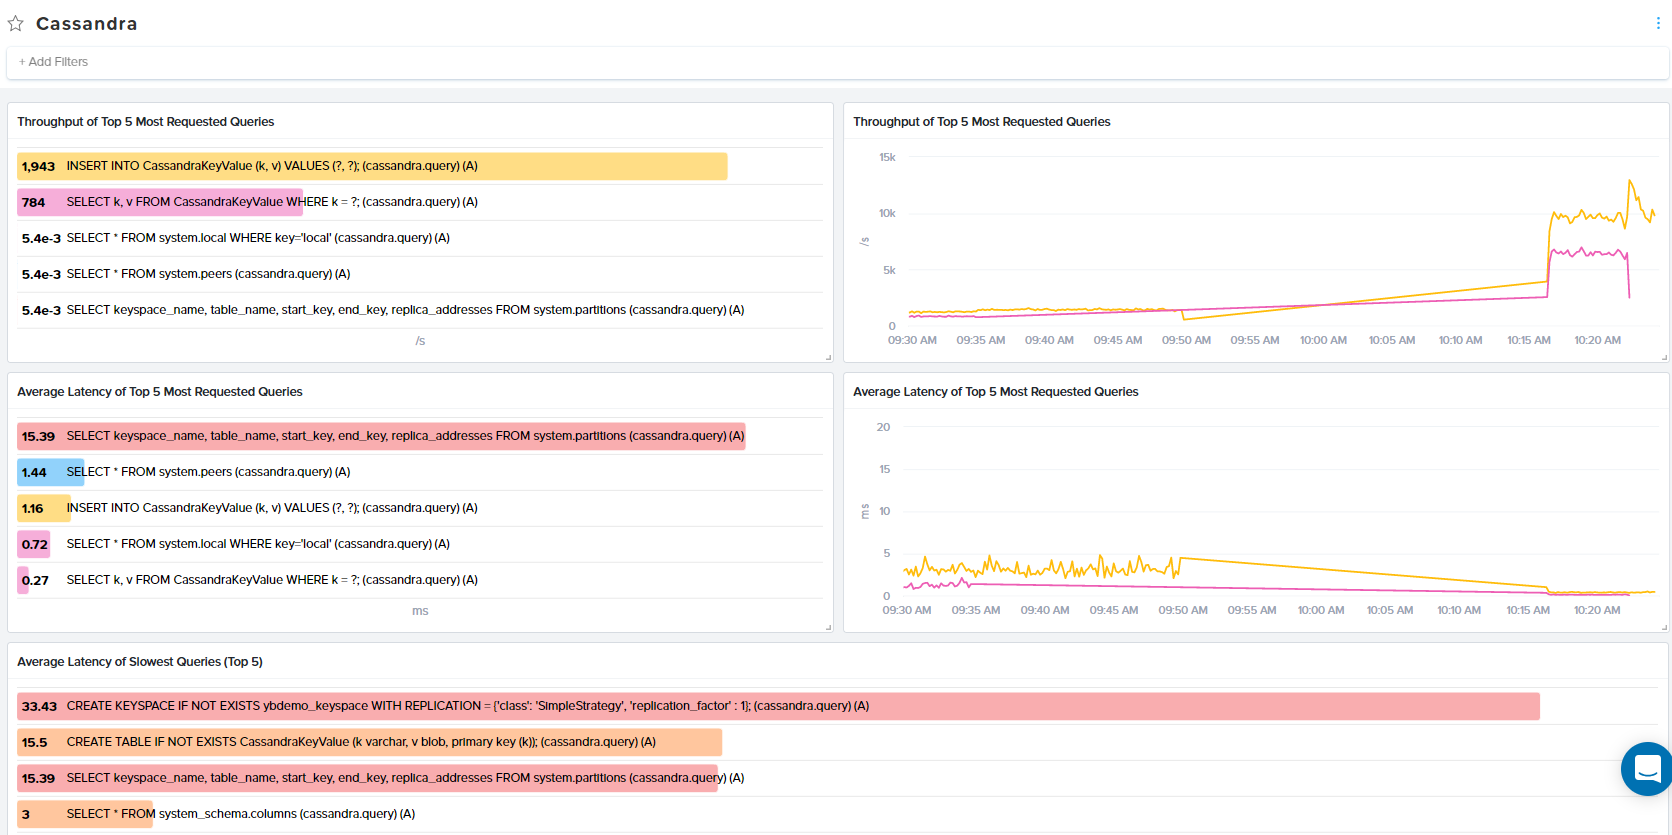
Below is YugaDB running Cassandra commands and Epoch is able to look at the traffic and report on how fast commands are happening and even give the most requested queries.


Some other features Epoch can provide:
  • Create and share maps by filtering and grouping by tags and traffic attributes.
  • Search and Discover services and their dependencies.
  • Monitor real-time traffic flow between all internal and external services.
  • Use Pagerduty, email or webhooks integration for alert notifications.
  • Time Travel to compare behavior, for example, before and after deployments.
  • Application Integrations with JMX, NGINX, MySQL and others, for metrics such as heap size, thread counts, connections, etc.
The best part to me is that the application code doesn't have to be touched.
Try it out for free, https://login.epoch.nutanix.com/#/signup

This topic has been closed for comments

6 replies

Badge +1
Hi,

In some of these tutorials it shows a variety of tags to filter by when creating and filtering the Maps. I'm investigating and researching now, but I am missing the correlation of how to create these tags in the environment for EPOCH to pick up and filter on. I've noticed from the base install, that EPOCH reports some of the pods with "no_name" when they have a pod name associated. It has made me think there is some sort of label or annotation needed per container for EPOCH to pick up? Can you help explain or point me to an example of how someone would set the tagging for their containers for EPOCH to pick up and filter on? This is a bare-metal environment and not in AWS or another cloud that leverages a tagging system.

Thanks!
-Keith
Userlevel 4
Badge +19
You can add tags using the `EPOCH_TAG` environment variable while installing the collectors.
Please look at this documentation where we explain how tagging works https://docs.epoch.nutanix.com/integrations/tagging-infrastructure/

Let me know if that doesn't help
Badge +1
Thanks dlink7,

I had read that section and went with the implementation of the tags post-install with the config file. I have created the tags.yaml file on both collectors and restarted, but I am not seeing the test tag I created in the interface. Part of what I might be missing is where these tags are supposed to show up and be applied in the dashboard? If I define a tag in the yaml file like this:

--- # define instance tags here
- tag
- Owner:Keith

Should I see this tag to apply and group VM's in the dashboard? If so, I am not seeing the tags or how to do that from my initial testing.

Or does the usage of that tag require me to add something to the containers/POD definitions themselves to show up in the dashboard?

It the how-to usage flow of tags that I am not seeing in the documentation and thus not sure what to expect that I was hoping to get some clarification on.

Thanks!

-Keith
Userlevel 4
Badge +19
For containers you would do it on the docker/K8's side.

https://kubernetes.io/docs/concepts/overview/working-with-objects/labels/

as to why the vms are not working i am not sure. Let me grab someone from the epoch team to respond.
Badge +1
Hi dlink7,

I have a support case for the VM issue and was able to figure out the tags as part of it (support was extremely helpful!). It looks like they aren't labels on the K8S, but rather tags that are set in the collector.yaml file when deploying the collectors (or post-install). It appears that these tags are set here versus created through the dashboard. Here is an example of what I was able to set for 2 tags in the collector.yaml file, redeploy the collectors, and then have it show up in the dashboard for usage:

Collectors.yaml file:

env:
# DO NOT prepend http:// or https:// to the EPOCH_SERVICE_HOST value
....
- name: EPOCH_TAGS
value: "tag1,env:production,tag2,env:lab"


Once redeployed they will show when looking at the container:

kubectl describe po :

Environment:
EPOCH_TAGS: tag1,env:production,tag2,env:lab


And finally, when looking at the metrics in the dashboard you can no filter by the tags:


From here I'll play around with some of the regex matching, but it all seems to be working at this point from a tags perspective.

Thanks!

-Keith
Userlevel 4
Badge +19
Thanks for replying back with the answer.