


Here I am at London Luton airport waiting for my delayed flight to KubeCon 2019 in Barcelona. Three hours ‘free’ to write a new blog, this time about how to deploy Grafana on Nutanix Karbon.
When deploying a Kubernetes cluster with Karbon you get by default few add-ons like logging with EFK (Elasticsearch, Fluentd and Kibana) or monitoring with Prometheus.
Today the visualisation of Prometheus in Karbon is just for alerts. If you are looking to gather metrics information you will need to deploy Grafana as the visualisation interface. In this blog I’ll show you how easy and quick is to deploy Grafana with Tillerless Helm. Because Karbon is open and upstream Kubernetes, there is no need of complex configurations.
Prerequisite
Before you can proceed with the installation of Grafana, you will need to install Helm. I wrote a blog about how to do it in a secure manner. Refer to Tillerless Helm on Nutanix Karbon blog for the installation.
Install Grafana
As mentioned before, every Kubernetes cluster in Karbon has Prometheus running in the ntnx-system namespace. We will use Prometheus as the datasource for Grafana.
Make sure you have started the tiller client:
helm tiller start
The following command will install Grafana in the ntnx-system namespace, using the built-in Prometheus as datasource. You will get as part of the deployment several dashboards too, so you can visualise your Kubernetes cluster right away. Grafana will be externally published using NodePort. Make sure you list the services to capture what port has been assigned to the Grafana service.
helm install stable/grafana \ --name grafana \ --namespace ntnx-system \ --set persistence.enabled=true \ --set datasources."datasources\.yaml".apiVersion=1 \ --set datasources."datasources\.yaml".datasources[0].name=Prometheus \ --set datasources."datasources\.yaml".datasources[0].type=prometheus \ --set datasources."datasources\.yaml".datasources[0].url=http://prometheus-k8s.ntnx-system.svc.cluster.local:9090 \ --set datasources."datasources\.yaml".datasources[0].access=proxy \ --set datasources."datasources\.yaml".datasources[0].isDefault=true \ --set dashboards.default.kube-capacity.gnetId=5309 \ --set dashboards.default.kube-capacity.revision=1 \ --set dashboards.default.kube-capacity.datasource=Prometheus \ --set dashboards.default.kube-cluster-health.gnetId=5312 \ --set dashboards.default.kube-cluster-health.revision=1 \ --set dashboards.default.kube-cluster-health.datasource=Prometheus \ --set dashboards.default.kube-cluster-status.gnetId=5315 \ --set dashboards.default.kube-cluster-status.revision=1 \ --set dashboards.default.kube-cluster-status.datasource=Prometheus \ --set dashboards.default.kube-deployment.gnetId=5303 \ --set dashboards.default.kube-deployment.revision=1 \ --set dashboards.default.kube-deployment.datasource=Prometheus \ --set dashboards.default.kube-master-status.gnetId=5318 \ --set dashboards.default.kube-master-status.revision=1 \ --set dashboards.default.kube-master-status.datasource=Prometheus \ --set dashboards.default.kube-nodes.gnetId=5324 \ --set dashboards.default.kube-nodes.revision=1 \ --set dashboards.default.kube-nodes.datasource=Prometheus \ --set dashboards.default.kube-pods.gnetId=5327 \ --set dashboards.default.kube-pods.revision=1 \ --set dashboards.default.kube-pods.datasource=Prometheus \ --set dashboards.default.kube-resource-request.gnetId=5321 \ --set dashboards.default.kube-resource-request.revision=1 \ --set dashboards.default.kube-resource-request.datasource=Prometheus \ --set dashboards.default.kube-statefulset.gnetId=5330 \ --set dashboards.default.kube-statefulset.revision=1 \ --set dashboards.default.kube-statefulset.datasource=Prometheus \ --set dashboardProviders."dashboardproviders\.yaml".apiVersion=1 \ --set dashboardProviders."dashboardproviders\.yaml".providers[0].orgId=1 \ --set dashboardProviders."dashboardproviders\.yaml".providers[0].type=file \ --set dashboardProviders."dashboardproviders\.yaml".providers[0].disableDeletion=false \ --set dashboardProviders."dashboardproviders\.yaml".providers[0].options.path="/var/lib/grafana/dashboards/default" \ --set service.type=NodePort
To find the Grafana service port in Kubernetes you can run this.kubectl -n ntnx-system get service grafana NAME TYPE CLUSTER-IP EXTERNAL-IP PORT(S) AGE grafana NodePort 172.19.183.8 80:31324/TCP 10d
In this example you can see the port 31324 has been assigned to my Grafana service. Now you can open a browser and use the IP address of any of your workers with the port from the previous command. A quick way to get the worker IP addresses is:kubectl get no -o yaml | grep address addresses: - address: 192.168.2.197 - address: karbon-dnd-devops-stack-4f5d9a-k8s-master-0 addresses: - address: 192.168.2.104 - address: karbon-dnd-devops-stack-4f5d9a-k8s-worker-0 addresses: - address: 192.168.2.105 - address: karbon-dnd-devops-stack-4f5d9a-k8s-worker-1
In my case I’ll open a browser to http://192.168.2.104:31324
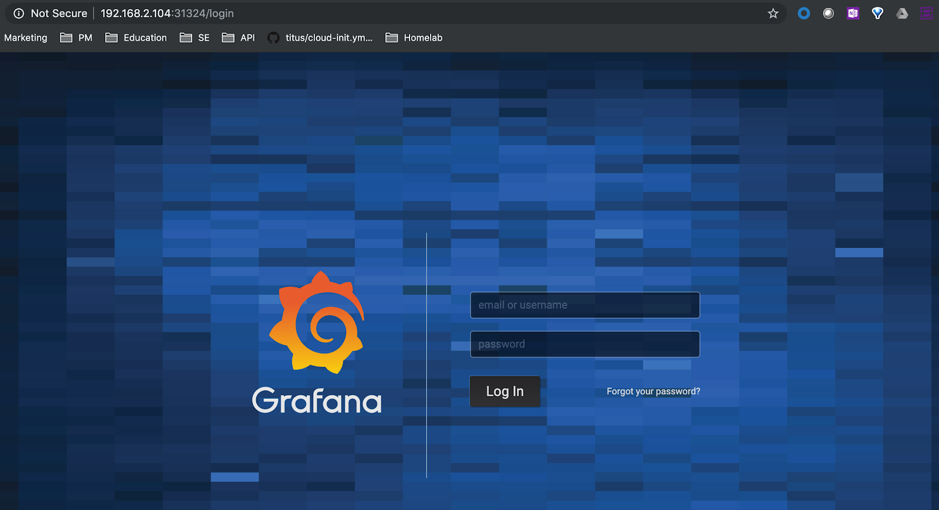
Accessing Grafana
Last step is to get the Grafana credentials. The default user is admin, but the password is dynamically generated for each Grafana installation.
Run the following to get the admin passwordkubectl get secret --namespace ntnx-system grafana -o jsonpath="{.data.admin-password}" | base64 --decode ; echo
Go back to your browser and introduce the credentials.

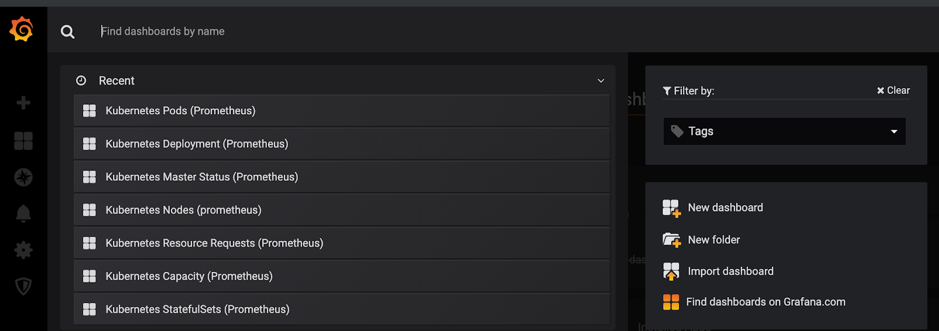
If you click Home on the top left corner, you will get the list of the dashboards we have installed as a part of the Helm command.
Here an example of the Kubernetes Capacity dashboard.
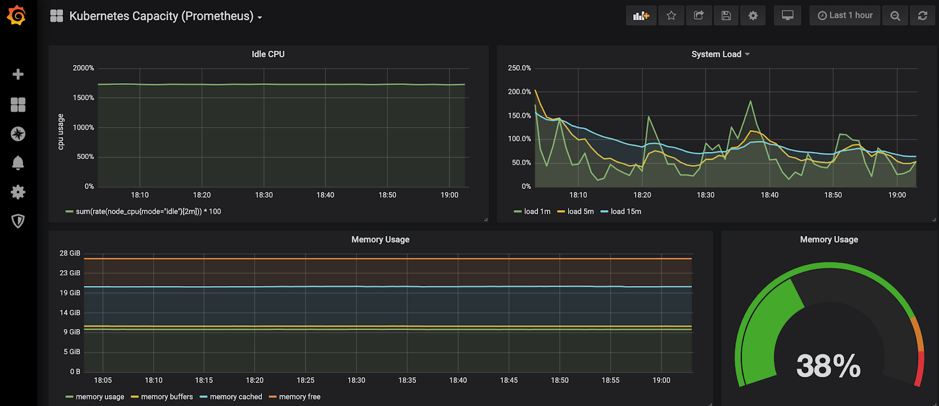
The dashboards we have installed are part of the Grafana community. In this case they have been created by Feisky (https://grafana.com/orgs/feisky/dashboards), thank you!!!
I hope you have enjoyed this quick blog about how to install Grafana in your Kubernetes cluster.